Participating HEIs gave feedback on their experience of preparing submissions through a set of structured questions, though they were given scope to provide additional feedback which did not fit the direct questions. Assessment panels also provided their feedback reporting directly to the REF team giving their reflections on the assessment processes after each round of meetings, and producing informal feedback reports at the conclusion of the exercise. In general, the feedback from the assessment panels was in close alignment with the feedback from the participating institutions. Feedback is presented below from both of these key stakeholders in the pilot.
The majority of participating institutions and the assessment panels felt that the piloted enablers were broadly clear and appropriate, though there were overlaps and there is potential to combine them, and that a simplification of the framework would be welcome. There was some discussion around whether a single statement with some flexibility to cover the different enablers might be simplest, but the balance of opinion suggested that a more structured template would be easier to complete (and may lend itself to a more efficient assessment). In addition, participating institutions suggested that clearer descriptions of the enablers are needed. These were very broad in the pilot, and it was not always clear what the ‘exam question’ was.
More broadly, careful consideration will need to be given to how the PCE elements and the Environment elements from previous REF exercises are integrated together. The Environment elements (such as income, infrastructure and facilities) were not explicitly assessed in the pilot, but it is anticipated that they will remain an important part of the assessment.
Feedback on each of the enabling factors is summarised below.
Feedback on enabling factors
- Context
Many institutions chose to include environment data as in REF 2021 (such as income and infrastructure data) for context, recognising that Environment was not to be explicitly assessed in the pilot. There was a clear understanding that this would be expected to be part of the assessment in REF 2029. However, it was felt that ‘Environment assessment’ should be broader than what was done in REF 2021 and should incorporate more than just income and infrastructure data. PCE should assess what is being done with the resources available; it should be about delivering the best possible outcomes with the resources available, not about rewarding institutions for attracting income; having more resources should not score highly if those resources are not being put to good use. - Strategy
Strategy was seen to hold a distinct role in framing institutional direction. Many institutions don’t have an explicit research culture strategy. With PCE still at the pilot stage within the REF it is unreasonable to expect institutions to have well-developed PCE strategies, but institutions should be demonstrating a strategic approach to developing or maintaining a positive research culture. There should not be a requirement to produce PCE strategies (or worse REF PCE strategies) where this is not appropriate for the institution. Submissions need only articulate what is the strategic research intent (as in, part of the research strategy for context) and then what are the specific objectives for activities encompassed under PCE. In many cases this could be highlighting parts of the research strategy relevant to the PCE assessment. Often strategy was seen as operating only at institution-level, due to its overarching nature and alignment with institutional governance. However, there was also a need to reflect on localised strategic priorities at unit-level. In some cases (dependant on the type of institution), there would be a unit-level strategy which could be distinct from the institution-level strategy. There may be bottom-up as well as top-down strategies and these need to be captured. However, the approach should be appropriate to the operating context of the institution, there should not be an expectation of a set of unit-level strategies generated just for REF. - Responsibility
Responsibility was felt to be mostly about compliance, and often only applicable at institution-level (for example, carbon emissions data). There was also a feeling that the indicators did not entirely address transparency and accountability, and specific feedback from institutions making submissions to arts and humanities was that traditional research integrity frameworks did not apply in all disciplines. - Connectivity
The Connectivity enabler covers a lot of indicators. Frequently it was described as too broad, with overlap with Engagement and Impact. There was a strong desire to refocus or split the enabler into clearer components. For example, there were suggestions that open research should be part of the Responsibility enabler. Clearer definitions of inter- and cross-disciplinary research are needed for this enabler. Collaboration was an important part of this enabler, however some small and specialist institutions felt that demonstrating this at scale would be challenging. - Inclusivity
Inclusivity was acknowledged as important, and it was key to include diversity of both people and research. However, Inclusivity was difficult to evidence at UoA level due to data suppression and small sample sizes. This was especially cited as an issue by small and specialist institutions where EDI concerns were particularly prevalent. Clear definitions of research enabling staff are needed here. Because of the issues with data, often Inclusivity was
evidenced by compliance with charters or concordats, which the panels found to be of limited use. - Development
Development was another broad enabler. Though this was seen as necessary and, for example, there was support for the inclusion of wellbeing, career porosity, and support mechanisms within this enabler. The focus of this enabler should be on people and therefore (as with other enablers) clear definitions of the people relevant to the assessment of PCE should be provided; for example, the term ‘research community’ was used to encompass the broader contributions to research, including research enabling staff.
Unit-level and institution-level assessment
There is a need to strike a balance between unit-level and institution-level assessment. And some enablers may lend themselves more easily to institution-level or unit-level assessment. Key here is being able to support sector diversity; there is a wide range of approaches, strategies and missions in the sector, and the assessment needs to be designed such that all of these approaches can be equitably assessed.
Unit-level and institution-level assessment are both necessary as a way of disentangling the differences between support at the different levels. If there are differences in performance between units within an institution, or if the performance of the unit is out-of-step with that of the institution, then this approach allows us to surface these issues and understand the reasons for the differential performance.
There is a need to integrate the assessment at unit- and institution-level. Statements at each level should be addressing different things and the guidance needs to be clear on this. At institution-level the statement should clearly articulate the policies and the strategic need for them; at unit-level, the statement should then explain how these policies are delivered and the impacts of those policies. However, there needs to be space to accommodate bottom-up strategies (meaning those developed within departments) as well as top-down. Not all policies are dictated to the unit by the institution.
Context and journey travelled
Assessment panels were clear that context was critical to the assessment of PCE. It is important to recognise that not all HEIs are operating with the same resources, and they are at different stages in their ‘PCE journeys’, this needs to be recognised and accounted for in the assessment. The highest scores should be achievable by any HEI working efficiently in focussed areas which have been targeted for strategic reasons. Panels felt that the distance travelled from their starting point (where institutions have shown an improvement) should be rewarded. However, journey travelled should not imply a need for constant growth and/or constant improvement of research culture when, in an environment of constrained resource, maintaining performance could be considered a success (such as doing the same with less, or maintaining an already excellent performance). However, there should be some reflection; if we expect institutions and units to be sustainable and resilient then they will need to reflect and adapt their approaches.
Participating HEIs agreed that context needs to be more clearly articulated and should be utilised in the scored elements of the assessment (in the pilot this section often incorporated some of the Environment data as used in previous REF exercises). There is tension here because HEIs are outlining their operating context and are being asked to reflect on any learning gathered and distance travelled; there was concern that this could introduce biases into the assessment process with the danger that bigger would be interpreted as better.
Simplification
There were various suggestions from the panels on how the enablers might be combined, or the framework might be simplified. One potential idea was that Responsibility and Connectivity could be related. There was debate about whether open research belongs in Connectivity, because it is about making connections and working with others, or in Responsibility, because Open Access is a responsible way to make research outputs available. Combining these enablers would side-step this debate. More generally working in a connected way could be seen as a responsible approach to research. Combining these two could remove the need to decide where exactly evidence should be submitted and could streamline the framework. Stronger references to environmental impact and social justice were also included here.
Similarly, Inclusivity and Development had some overlap because they incorporated the inclusion of all staff, and the supporting and developing of staff is part of ensuring they are included and engaged in the research culture. Again, combining these two enablers could streamline the framework.
Strategy remains an overarching theme, though consideration should be given to integration into the other enablers. One key aspect which could be strengthened was the necessary reflection that HEIs should be undertaking to refine and develop their ongoing strategy. The Context section was felt to be pertinent to the Strategy; HEIs are working with different resources and operating contexts, and this is important when considering strategy. Strategy should be seen as how an HEI is responding to the context in which it is operating.
Many of the participating HEIs provided the Environment elements from previous REF exercises in the Context section (for example, data and narrative on research doctoral degrees awarded, research income, and income in kind), the panels found this approach helpful, and suggested that these elements should be incorporated into the assessment of PCE.
These three combined enablers could be described as Environment, Culture and People as outlined below.
Possible combination of enabling factors
- Environment – Strategy in Context
Having robust, effective and meaningful plans to manage and enhance the vitality of the research culture and environment, with due account of the available resources and operating context. Mechanisms for reflection are in place to ensure the sustainability of the research culture. - Culture – Responsibility and Connectivity
Upholding the highest standards of research integrity and ethics, enabling transparency and accountability in all aspects of research. Working with a view to impacts on the environment and on social justice. Enabling collaboration at all levels through open research and engagement of research users and society, and through inter-disciplinary and cross-disciplinary approaches both within and between institutions. - People – Inclusivity and Development
Ensuring the research environment is accessible, inclusive, and collegial. Enabling equity for under-represented and under-recognised groups. Recognising and valuing the breadth of activities, practices and roles involved in research, building and sustaining relevant and accessible career pathways for all staff and research students, providing effective support and people-centred line management and supervision, supporting porosity and embedding professional and career development at all levels and across all roles.
However, there was some feeling that there were advantages to keeping the more granular framework; research culture was seen as being broader than just Responsibility and Connectivity and similarly Development and Inclusivity did not entirely capture the important elements to be addressed in supporting the people enabling and delivering research. A more granular framework would also allow a more nuanced approach to the assessment.
In addition, the panels agreed that consideration should be given to how PCE aligned with other elements of the REF exercise (CKU and E&I). For example, some aspects of Connectivity could find their home in E&I. However, there is a counterargument that PCE could draw in some of the aspects of CKU and E&I to produce a more streamlined framework overall.
There was a general need for clarity of definitions and some suggested definitions were:
- People
Staff who undertake research, including PGRs, and those in research-enabling roles, and how they are recruited, developed and offered career development support and opportunities, and how these are taken up and shape the environment. ‘Research-enabling staff’ refers to those in Professional Services roles, such as (but not exclusively) Technicians, Project Managers, Researcher Developer leads, those supporting bid development and colleagues in Libraries and IT Services who facilitate research activities. - Research culture
Behaviours, values, expectations, attitudes of our research communities, the strategies that support them and the means by which they are realised. - Environment
The intellectual and organisational environment within which research is conducted, and the income, infrastructure and facilities associated with this.
Assessment Criteria
The assessment criteria of Vitality, Rigour and Sustainability were considered as starting points in the pilot assessment, the criteria were expected to be developed as the assessment progressed.
Participating HEIs and assessment panels agreed that Assessment Criteria should take account of operating context and journey travelled. It is important to recognise that not all institutions are operating with the same resources, or working to the same institutional mission or strategy, and PCE should recognise where institutions are doing a good job with available resources, or working on delivering a positive research culture in focussed areas of their portfolio. The process of reflection and further planning is important, and this could be better reflected in the assessment criteria and in the quality descriptors, though not necessarily through the introduction of the additional criterion of Rigour. Generally, the participating HEIs and assessment panels recommended that the assessment should retain the criteria of Vitality and Sustainability. Feedback on the assessment criteria is summarised below.
Feedback on assessment criteria
- Vitality
Vitality was one of the criteria used for assessment of environment in REF 2021. It was generally felt to apply well to the assessment of PCE, and was well understood by the participating HEIs and assessment panels. However, Vitality requires clarity in language, for example ‘thriving’ could be interpreted as vague and subjective. In addition, Post-92 and small and specialist institutions emphasised the need to reflect localised progress rather than sector-wide influence. - Sustainability
Sustainability was one of the criteria used for assessment of environment in REF 2021. It was generally felt to apply well to the assessment of PCE, and was well understood by the participating HEIs and assessment panels. However, concerns were raised about articulation of Sustainability in the current climate. Financial sustainability could be working well with less resource, for example ensuring that the research environment remains resilient in a contracting sector. This criterion was seen as important but there were concerns around whether it includes future planning, resilience and adaptability. Generally, sustainability was seen to be demonstrated at a strategic or institution-level. Smaller institutions and Post-92 institutions noted that sustainability is often tied to institutional investment, research intensive institutions focussed on the need to align sustainability with strategic planning and infrastructure. - Rigour
Rigour was introduced to understand how HEIs were reflecting on their practice and striving for continuous improvement. Rigour was seen as problematic because of the difficulty in measuring the robustness of the processes in place, this could be difficult for smaller data sets, and therefore for smaller institutions/units. Rigour was frequently described as ambiguous and overlapping with other criteria, making it confusing. HEIs asked for clearer definitions like deleting or refining ‘meaningful’ in the phrase ‘meaningful mechanisms and processes’. Smaller institutions were concerned about being penalised for not having formalised processes. HEIs making submissions to arts and humanities UoAs questioned how rigour applies outside of traditional scientific contexts.
The pilot panels and participating HEIs agreed that not all criteria applied across all of the enablers, or that all criteria were the same at unit-level and institution-level. For example, Vitality and Sustainability seem to align more naturally with the Strategy and Development enablers, while Rigour may have more relevance in the Responsibility or Connectivity enabler.
A revised set of criteria were proposed and discussed by the panels. In particular, it was suggested that the criterion of Rigour should be re-focussed as Reflection, described below.
Possible revision of assessment criteria
- Vitality
The extent to which the institution/unit fosters a thriving and inclusive research culture and empowers individuals to succeed and engage in the highest quality research outcomes. - Reflection
The extent to which the institution/unit reflects on and evaluates the impact of its policies on research culture, people and environment. This includes sharing of good practices and learning, embracing innovation and demonstrating a willingness to learn from experiences. - Sustainability
The extent to which the institution/unit ensures their research culture, people and environment remain healthy and build for the future. This should include sustained investment in people and in infrastructure, effective and responsible use of resources and the ability to adapt and remain resilient to evolving needs and challenges.
However, there was some feeling that Reflection could be covered in other areas of the assessment framework (such as the quality descriptors), and consideration should be given to whether this criterion could be dropped, leaving Vitality and Sustainability as in REF 2021.
Quality Descriptors
Feedback on the quality descriptors for assessment was that the focus on research culture only as a means of generating research (outputs) was not helpful for the assessment of PCE, the wording of ‘conducive to producing research…’ was felt to be problematic in this context. Instead, the assessment should seek to capture the quality of research environment and culture, and the support for people. This will provide the foundation for the generation of high-quality research output and impact, and these aspects will be measured by the other elements of the REF exercise. The quality descriptors could be revised to reflect this.
Both the participating HEIs and the assessment panels felt that the most helpful approach was that the descriptors should refer to evidence that a policy was in place, evidence that the policy was being followed, evidence that the policy was having an impact and evidence that the policy was influencing the sector. There was also general agreement that the requirement for an institution or unit to have influence on the broader sector was problematic and might restrict four-star performance for some types of institution (such as those with more of a teaching focus). Instead, the assessment panels considered a self-reflection and continuous improvement approach to be the requirement for four-star quality.
This could be reflected in a revised set of quality descriptors based on a maturity framework as outlined in Table 2.
| Rating | Descriptor | Full description |
|---|---|---|
| 0 | Identification | The need to develop a strategy or approach is recognised, but a clear course of action is not established, or evidence provided does not justify that an appropriate strategy is in place. |
| 1* | Intent/Initiative (policy and guidance) | A policy or approach is in place outlining strategy, priorities and indicators of positive research culture. |
| 2* | Implementation (engagement, training and support) | There is evidence that the approach is being followed and that there are mechanisms for evaluation. |
| 3* | Impact (action and delivery) | There is evidence that the approach has a positive impact on research culture and as a result people achieve better results, including examples. |
| 4* | Insight (monitoring and reflection) | There is evidence that the institution has reflected on the approach and has sustainable plans for the future strategy development. This could include sharing of good practice, and/or learning from experiences. |
These quality descriptors were seen as additive, in that institutions will need to be achieving the requirements for 1* before they can get 2* etc. reflection and monitoring are not sufficient for 4* quality if there is no evidence that the policy has been implemented.
There were some differing opinions on defining 4* research culture. It could be about exhibiting exemplary practice and continual improvement through both outreach (disseminating ideas to the wider sector) and in-reach (seeking and incorporating best practice from across the sector). There was some feeling that retaining influence as a criterion for 4* quality was useful (some panels saw this in submissions and felt it should be recognised) but that that influence should not be a requirement for 4* research and that it could be either internal or external influence.
Indicators
For the pilot the guidance was flexible suggesting examples of quantitative and qualitative evidence and contextual information, but allowing scope for participating HEIs to cite evidence in multiple sections of the template (as in, for multiple indicators across multiple enablers), and institutions were told not to feel constrained by the examples given and were encouraged to provide any additional evidence they felt better represented their performance in PCE.
In general, participating HEIs and assessment panels felt that indicators were largely with the correct enabler, though there were overlaps. Some HEIs wanted clear guidance on where an indicator was being used, others felt the overlaps were manageable. Similarly, some HEIs felt that the relationship between the indicator and the suggested sources of evidence was not always clear. Assessment panels managed the assessment with the evidence available and were able to look for and consider appropriate evidence in other sections of the template.
Flexibility and focus
There was general agreement that narrative was a critical part of the submissions, evidence should be seen as provided in support of the narrative, though there was acknowledgement that narrative without supporting evidence would not be conducive to a robust assessment. This approach would benefit from the flexibility of evidence sources which was trialled in the pilot.
The assessment panels felt that the volume and nature of the evidence provided in the pilot submissions was more than was required for a reasonable, yet robust assessment. One approach to consider would be a framework where HEIs are given scope to identify their own areas of focus within PCE, they should provide a rationale as to why they have chosen to focus on these areas and an explanation of how they are exhibiting excellent performance, or improving performance, in these areas. Overall, the PCE assessment should be about identifying and rewarding excellence as a way of highlighting and sharing good practice in the sector.
Some submissions included case studies, and this was generally appreciated by the panels. However, there was acknowledgement that this would increase the burden of preparing and assessing submissions. An approach which allows HEIs to focus on certain aspects of their research culture could allow the specific discussion of certain aspects of research culture without the requirement of case studies.
Mandatory data and evidence
Some high-level metrics or evidence sources are required in the assessment to facilitate comparison between submissions. These would need to be existing sources of data that were already being collected by HEIs across the sector, (by all types of institution) and ideally they should be collected centrally by the REF team (such as HESA data) and could include many of the data sources used for assessment of Environment in previous REF exercises. Meaningful benchmarks for these data sources should also be provided to facilitate assessment. Consideration should be given to differences in the mandatory data at Main Panel level.
Optional supporting evidence
There was concern that having optional metrics and evidence may not be interpreted as intended; submitting HEIs may feel that they will be disadvantaged if optional evidence is not provided. In order to mitigate the burden, lists of suggested additional evidence sources should be provided, and guidance should be clear that these additional sources were optional and should only be included where available and pertinent. HEIs may also choose to include additional evidence not listed in the guidance, where they felt it appropriate to represent their performance. In particular, consideration should be given to any required sources of evidence at unit-level, as there are particular issues with small institutions and small units and there was a significant burden in providing unit-level data, and potential issues with providing data which did not identify individuals.
Staff data
Staff data need to be clear. This is not just staff with responsibility for research, or staff which contribute to the volume measure. Ideally the assessment of PCE should encompass all staff who contribute to the research process generating new meaningful knowledge and understanding. However, in practice there may need to be some compromises struck allowing for what data are available. There was universal agreement that a clear definition of staff for PCE was required, and this should be a single PCE definition across all enablers and indicators.
Refinement of Indicators
The aim of the pilot was to test a wide range of potential indicators of positive research culture with the intention of focussing on a tighter set for the full-scale assessment. The participating HEIs were clear that the range of indicators in the pilot would be unmanageable for a full exercise. Any compulsory indicators should be carefully selected to ensure that they can be fairly applied across all types of institution. It was also clear that data were not always available to different institutions (for example, KEF data are only available to English institutions); in many cases collection of data placed significant burden on the institutions and/or would be impossible to collect retrospectively. We should also consider where data could be collected automatically to reduce burden, this would not be possible for many of the proposed indicators.
The participating HEIs had a wide variety of observations on the indicators.
- In many cases the relevant population for the indicator was unclear. The guidance will need to clearly define what is meant by people in the PCE assessment, and ideally this definition should align with broader REF definitions.
- Many of the indicators focussed on quantitative measures which might not be appropriate for the assessment and could shift the focus of the assessment onto performance rather than purpose. It would be better if indicators steered towards concrete examples of initiatives or policies and their impact rather than just recording data or providing evidence or documenting processes.
- Many of the indicators could not be evenly applied across the exercise. They might not be appropriate for all disciplines, or data may not be available for all types of institution. Careful consideration should be given to the broad applicability of indicators in a full-scale exercise.
- The descriptions of the indicators were open for the pilot and this flexibility was a necessary part of the process; there was a general feeling that descriptions will need to be more tightly worded for the full guidance, though some appreciated some flexibility in the assessment framework.
The assessment panels gave careful consideration to the rationalisation of the list of indicators and evidence with a view to reducing the list of piloted indicators to a much tighter framework for a full-scale REF exercise. Across the panels there was often differing opinions about indicators. In many cases some of the panels were supportive of an indicator, while others found it to be problematic. Similarly, in many cases the panels suggested substantial development or revision would be necessary for inclusion of an indicator. Finally, some indicators were considered important, but were not pertinent to the assessment and/or were captured by other existing processes (such as legal requirements or conditions of funding). Although these indicators are not recommended for inclusion in the assessment framework for REF 2029, they are considered important by pilot panels, they should not be discounted, and due consideration should be given to how they may be developed for inclusion in future exercises.
The lists of Indicators listed below are those where there was reasonable agreement between the panels that they were useful to the assessment and could be applied across a range of institutions and subjects/disciplines. These indicators are presented to the REF 2029 panels for consideration during the criteria setting phase of the exercise.
Indicators which were considered useful to the assessment and which could be broadly applied
- Context
How research is structured across the submitted unit (including research groups or sub-units), and how this relates to departmental or other administrative structures within the institution.
Operational and scholarly infrastructure supporting research within the submitting unit, including estate and facilities, advanced equipment, IT resources or significant archives and collections. - Strategy
Documented evidence of the strategy and strategic priorities, with coherent plans towards their achievement. May include: Key Performance Indicators, descriptions of any consultation or co-creation activities, reporting lines and accountability mechanisms, approaches for monitoring and evaluation.
Data on improvement as a result of strategic initiative(s). - Responsibility
Conformity of measures with the Concordat to Support Research Integrity, including through cross-references to annual reporting. Though compliance alone is not pertinent to the assessment, institutions should demonstrate where such policies have had an impact on their research culture and environment.
Documented evidence that membership of relevant committees or involvement in other relevant academic citizenship activities is appropriately recognised (for example, in workloads or promotion criteria).
Documented evidence of participation in relevant networks, events and initiatives leading to changes in policy and practice. - Connectivity
Documented evidence that the infrastructure, processes and mechanisms in place to support staff and research students to share research, knowledge and expertise are working effectively.
Support for the development of research networks, centres, groups and events (such as waiving room hire charges, communications).
Documented evidence of the quality and significance of research collaborations across different disciplines, institutions, or with external partners, organisations or communities.
The number and disciplinary spread of co-authored or co-produced research outputs and activities.
Documented steps towards open research that go beyond Open Access (for example, support for open/FAIR data).
The number and share of openly-accessible research outputs and activities (for example, open databases, public performances).
Number of times shared datasets are accessed or downloaded on openly-accessible platforms. - Inclusivity
Numbers of each of the following:
– Technical and research-supporting staff
– Newly employed early career researchers
– Staff employed on permanent, fixed-term and atypical contracts
Longitudinal data on research and research enabling staff:
– With no known disability, disability declared or unknown
– Declaring male, female, other or unknown
– Declaring as white, Black, Asian, other/mixed or unknown at institution-level.
Longitudinal data on average (mean and median) institutional gender, ethnicity and disability pay gap (for academic and research-enabling staff stratified by grade).
Documented evidence of implementation of principles and practices from responsible research assessment initiatives, such as those outlined in CoARA or DORA.
Documented changes to assessment processes, criteria and guidance, as informed by responsible research assessment principles.
Evidence of how equality and diversity issues are addressed, in relation to support for acquiring research funding, or accessing scholarly or operational infrastructure.
The development of targeted leadership programmes and demonstrate that under-represented groups are enabled to participate and benefit.
Activities to prevent harassment and bullying, including awareness-raising, training and the creation of safe spaces.
Monitoring and assessment of the effectiveness of mechanisms to safeguard and protect whistleblowers or victims of bullying and harassment, including resolution satisfaction. - Development
Tailored approaches to supporting staff and research students at different career stages and on different contract types (for example, the provision of adapted teaching workloads, mentoring and coaching, and targeted and relevant professional development opportunities).
Support for the development of staff support networks and groups.
The development of career pathways frameworks, including for fixed-term, technical and research-enabling staff, that outline progression routes, expectations and signposting of development opportunities.
In many cases the indicators highlighted here were already present in the REF 2021 assessment, for example they are closely aligned with the ‘Guidance for institutions on environment indicators’ produced by the Forum for Responsible Research Metrics ahead of the REF 2021 exercise. Incorporation of these elements into the REF 2029 exercise would represent a strengthening of existing elements rather than introduction of completely new indicators.
Submissions Template
Feedback was that the flexibility allowed in the pilot submissions was helpful to some extent, however, overall a more structured template, with specific questions focussed on a shorter list of enablers, would be required for the REF 2029 exercise.
The template and guidance to participating HEIs in the pilot were deliberately open to allow flexibility in the approaches taken and the participating HEIs were asked to provide as much evidence as they could at both institution- and unit-level. However, panels and participating HEIs agreed that the template would benefit from more structure and focussed questions.
The same template was used for both levels of assessment in the pilot. The intention was to test which aspects of the assessment better lent themselves to institution-level and which to unit-level. Although it was also acknowledged that there was significant overlap between the institution-level and unit-level submissions, there was agreement that there should be differences in the expectations (and therefore in the templates and guidance) at institution- and unit-level, and the appropriate approach to this needs to be clearly defined to avoid duplication of effort. There was general agreement that assessment at both levels was important.
An approach which was generally supported by the assessment panels was for strategies and policies to be outlined and data to be provided at institution-level; and for implementation and impact of strategies to be described at unit-level. Preference was to avoid overlap by having separate statements but allowing cross-referencing to avoid duplication (so that unit-level statements could refer to institution-level policy and then provide detail at unit-level). Small and specialist institutions often had centralised policies, making it more difficult to differentiate institution- and unit-level practices. Suggestions were to allow a single integrated submission for such institutions or allow institutions to opt-in to unit-level statements.
Many of the indicators could be seen as relevant to more than one enabler. Similarly, there was no clear direction on whether indicators were optional or to be expected by the assessment panels. This was deliberately left open in the pilot, and panels were clear that they were not marking on a subtractive model (participating HEIs should be reassured that panels were not ‘looking for what is missing’). However, there was agreement that clear guidance on where each indicator should be applied and what would be requirements would be necessary for the full exercise.
Word limits
Participating HEIs felt that the word limits (of 1,000 words per enabler) were generally too restrictive, especially for institution-level statements. Some of the enablers had a lot of indicators to cover and this meant there wasn’t sufficient space to cover all of them in sufficient depth. There was a general feeling that both increased word limits and a focussed list of indicators would be required. The most frequently suggested word limit was 1,500-2000.
There were suggestions of different word limits, for the statements at institution-level and unit-level, or a sliding scale of word limits depending on the size of the submission. However, the assessment panels gave clear feedback that longer submissions did not always equate to better performance in the assessment, and that larger institutions were not necessarily more complex (requiring higher word limits) than smaller ones. It was also suggested that some flexibility in the word limits for the different sections would be helpful (for example an overall word limit with flexibility on how many words are used for each enabler).
Audit
Concerns were raised regarding the anticipated level of audit required and the associated burden which might be created. The most frequent suggestion was to use verifiable existing data sources. Small and specialist institutions found it difficult to disaggregate data meaningfully at unit-level. Larger institutions struggled with complexity across multiple departments and divisions.
The assessment panels felt that evidence should be included ‘up-front’ and not sought through audit query during the assessment. Realistically the burden on HEIs preparing the evidence is no different as they would have to be prepared for audit queries in any case and assessment processes would be smoother if the need for panel-instigated audits could be minimised.
Results of the assessment
Assessment of the submissions was conducted by the assessment panels which evaluated each of the submissions assessing against the draft criteria. Panels arrived at scores for each of the enabling factors in the assessment framework (Strategy, Responsibility, Connectivity, Inclusivity and Development). Scores were based on the working definitions of quality descriptors, and panels used a 9-point scale (as in, 0, 0.5, 1, 1.5, 2, 2.5, 3, 3.5, 4) though for clarity in the summary statistics quality profile are presented on a 5-point scale (for example, a score of 1.5 has been included as half at quality rating 1 and half at quality rating 2). In a small number of cases the panels considered that the available evidence was insufficient for them to confidently arrive at a single score and suggested a range of scores, (for example, 2-3) and in these cases an average score was used in the analysis (for example, 2-3 was averaged as 2.5).
No formal calibration was conducted within the assessment panels, though most panels began their assessment by examining a sample of different submission types and reflecting as a group on how to arrive at scores for the different enablers in a consistent manner. Participating HEIs took a wide variety of approaches to their submissions and this was helpful in evaluating what was possible for the participating HEIs to provide, and what was useful for the assessment panels. However, it means that direct comparisons of one institution to another would not be robust. In the analysis we have sought to provide summary statistics to give overall indications of performance without making direct comparisons. The individual results will be shared with the participating HEIs for information, but we do not intend to publish results in the same way as for a full REF exercise.
Similarly, in order to minimise burden, there was no calibration between the different assessment panels (though this will be a feature of the REF 2029 exercise). The co-chairs of the unit-level panels were members of the institution-level panel and discussed the approaches taken by their panels, however it should be noted that, due to the nature of the pilot, panels took different approaches to their assessment and results of one assessment panel should not be directly compared with another. As with comparing one participating HEI to another, it would not be robust to compare the scores of a submission to one UoA with the scores to a different UoA. For the purposes of this analysis we have provided summary statistics to indicate overall performance.
Finally, there is an expectation that the assessment in REF 2029 will be different from the assessment conducted in the pilot. As noted above, the list of indicators and evidence sources should be refined and focussed and the Framework, Assessment Criteria and Quality Descriptors are all draft, they were refined during the pilot, and will be expected to be further refined for a full-scale exercise. REF 2029 will incorporate much of the existing assessment framework and processes from REF 2021 (such as infrastructure and income). Therefore, results of the pilot should not be interpreted as an indication of expected performance in REF 2029.
Overall (full pilot) results
In the following analysis summary statistics have been produced to give overall indications of performance without highlighting individual HEIs. In producing the summary statistics, scores have been weighted according to the FTE of the unit which was submitted to REF 2021 (so that submissions from larger institutions are given higher weighting than submissions from smaller institutions). This is in-line with production of similar statistics for REF 2021.
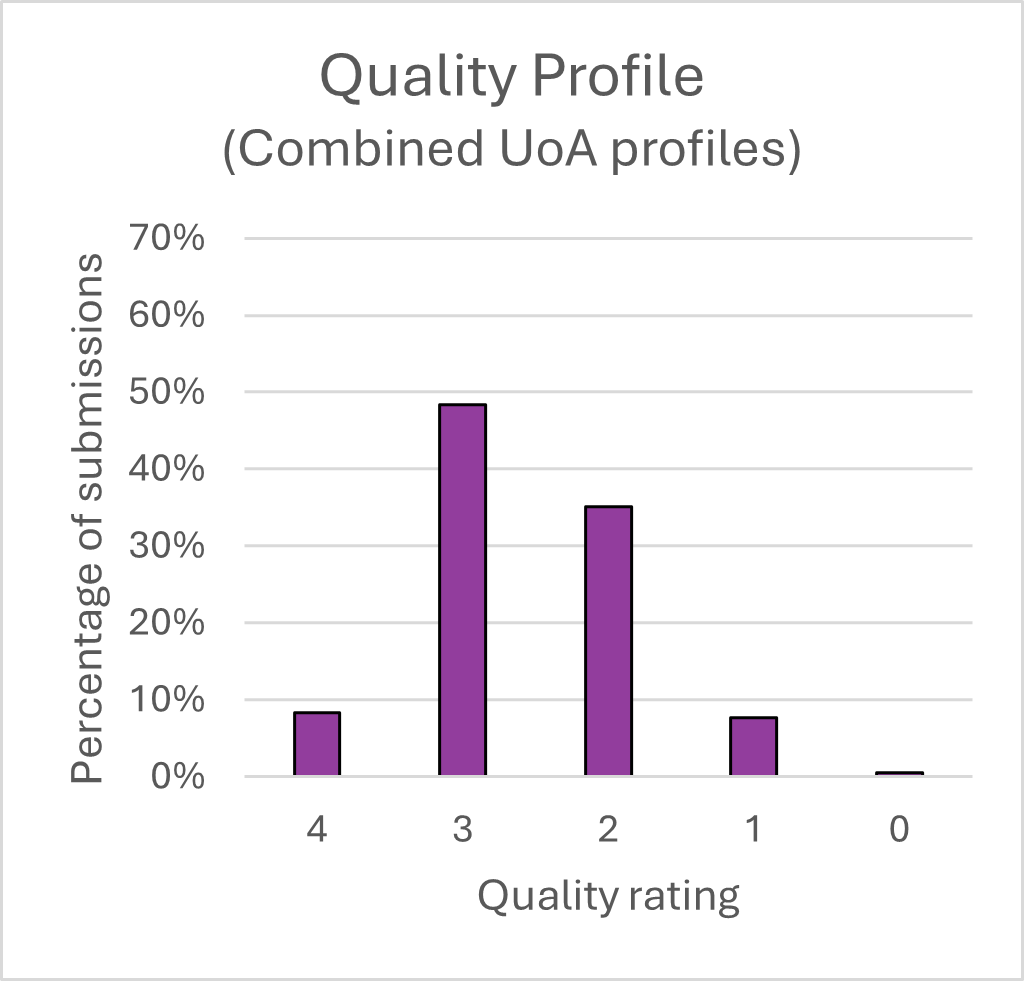
| Quality rating | Percentage of submissions |
|---|---|
| 4 | 8.3 |
| 3 | 48.4 |
| 2 | 35.1 |
| 1 | 7.6 |
| 0 | 0.5 |
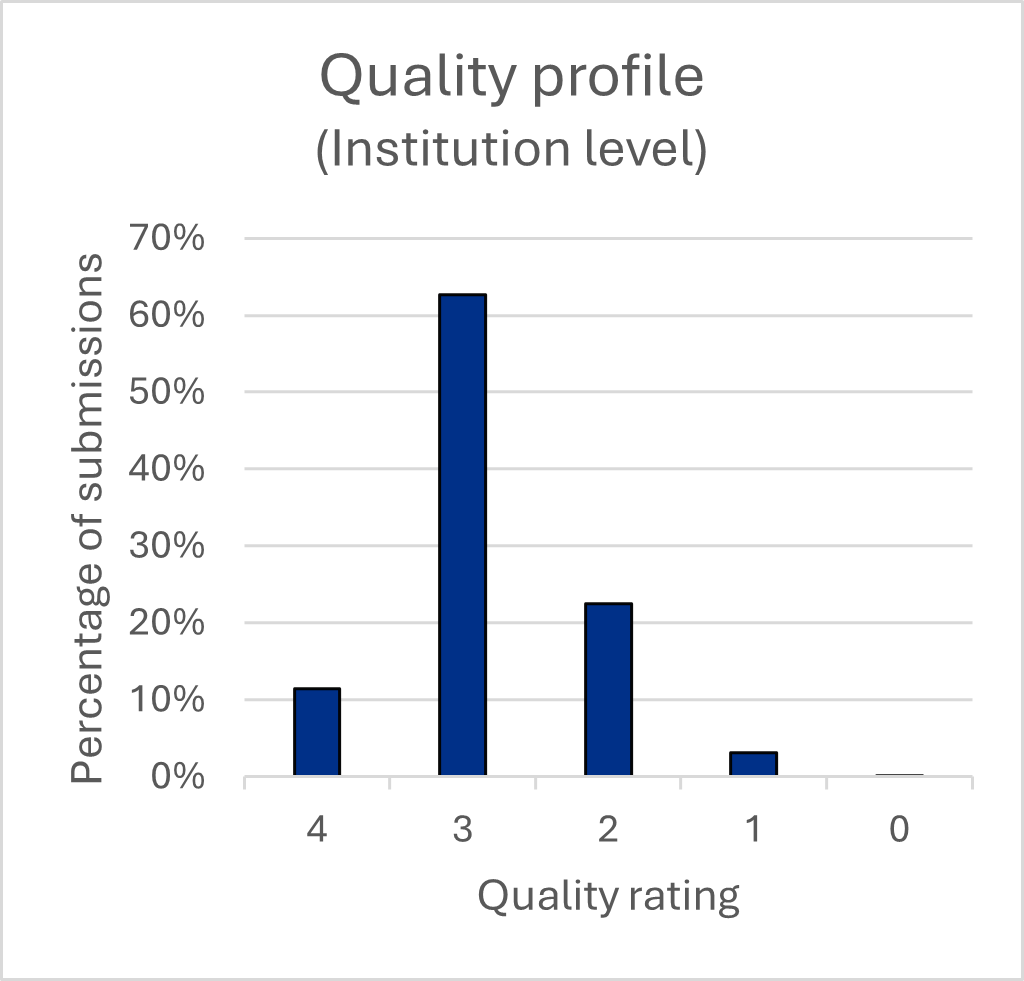
| Quality rating | Percentage of submissions |
|---|---|
| 4 | 11.5 |
| 3 | 62.6 |
| 2 | 22.5 |
| 1 | 3.2 |
| 0 | 0.2 |
Charts 1 and 2 are intended to give an overall picture of the quality of evidence observed in the pilot. Chart 1 incorporates all scores, for all five enablers, across all submissions made to the eight unit-level assessment panels. Chart 2 incorporates the same breadth of scores across submissions to the institution-level panel. Overall, scores across the pilot were lower than those for Environment assessment in REF 2021; this reflects the exploratory nature of the submissions and assessment processes being evaluated in the pilot. Many of the submissions produced in the pilot were experimental in nature; for example HEIs may have reported against a very wide range of indicators, or chosen to focus only in certain areas, and therefore lower average scores should not be unexpected. In addition, the pilot assessment did not incorporate the assessment of well-established elements such as income and infrastructure which might be expected to increase scores.
Enablers
The charts below (Charts 3 to 8) report the results of the pilot for each enabler.
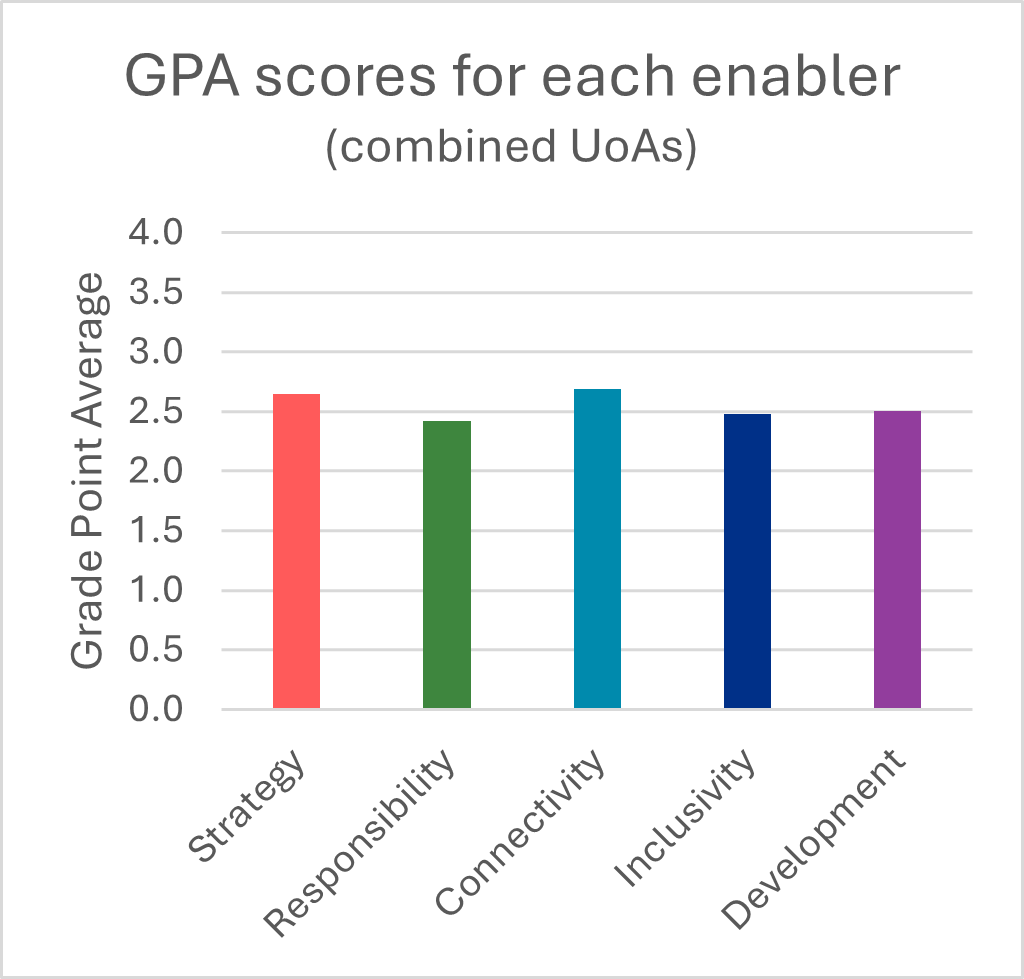
| Enabler | Grade Point Average |
|---|---|
| Strategy | 2.64 |
| Responsibility | 2.42 |
| Connectivity | 2.69 |
| Inclusivity | 2.48 |
| Development | 2.51 |
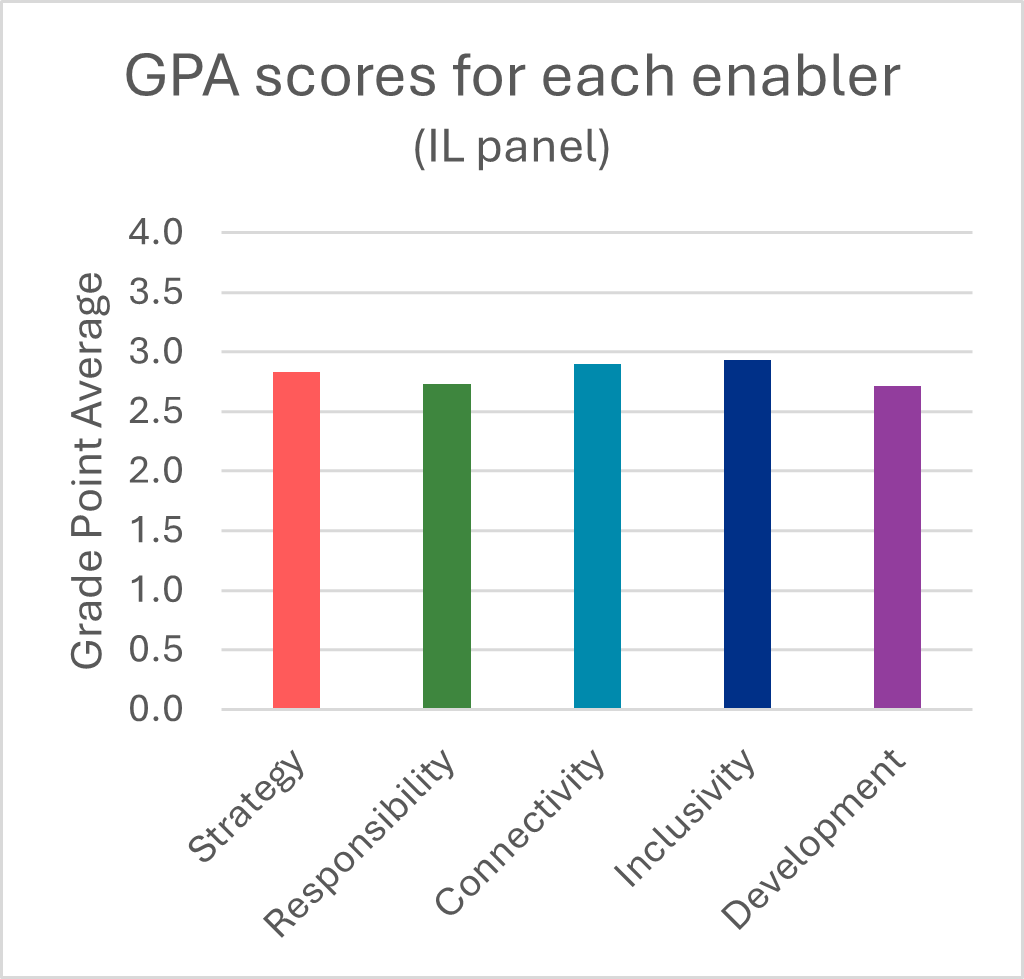
| Enabler | Grade Point Average |
|---|---|
| Strategy | 2.83 |
| Responsibility | 2.73 |
| Connectivity | 2.90 |
| Inclusivity | 2.93 |
| Development | 2.71 |
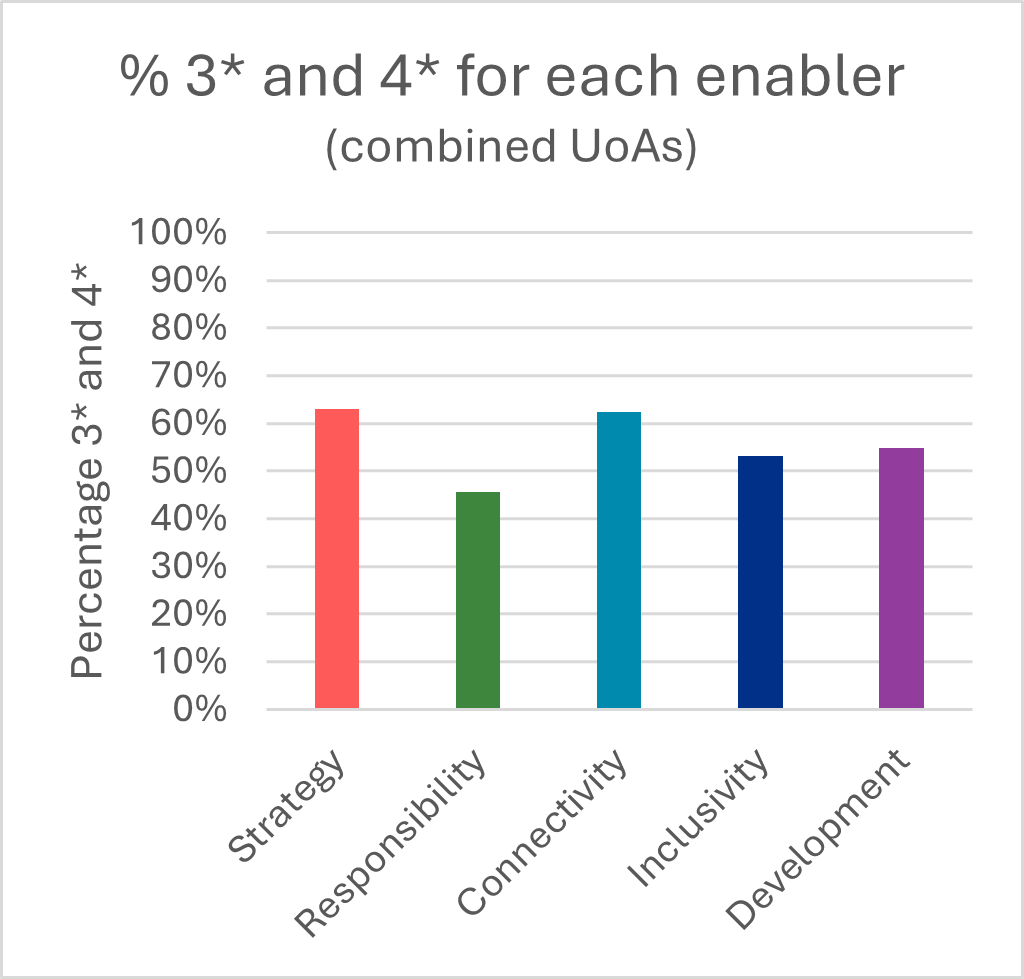
| Enabler | % 3* and 4* |
|---|---|
| Strategy | 62.9 |
| Responsibility | 45.5 |
| Connectivity | 62.3 |
| Inclusivity | 53 |
| Development | 54.7 |
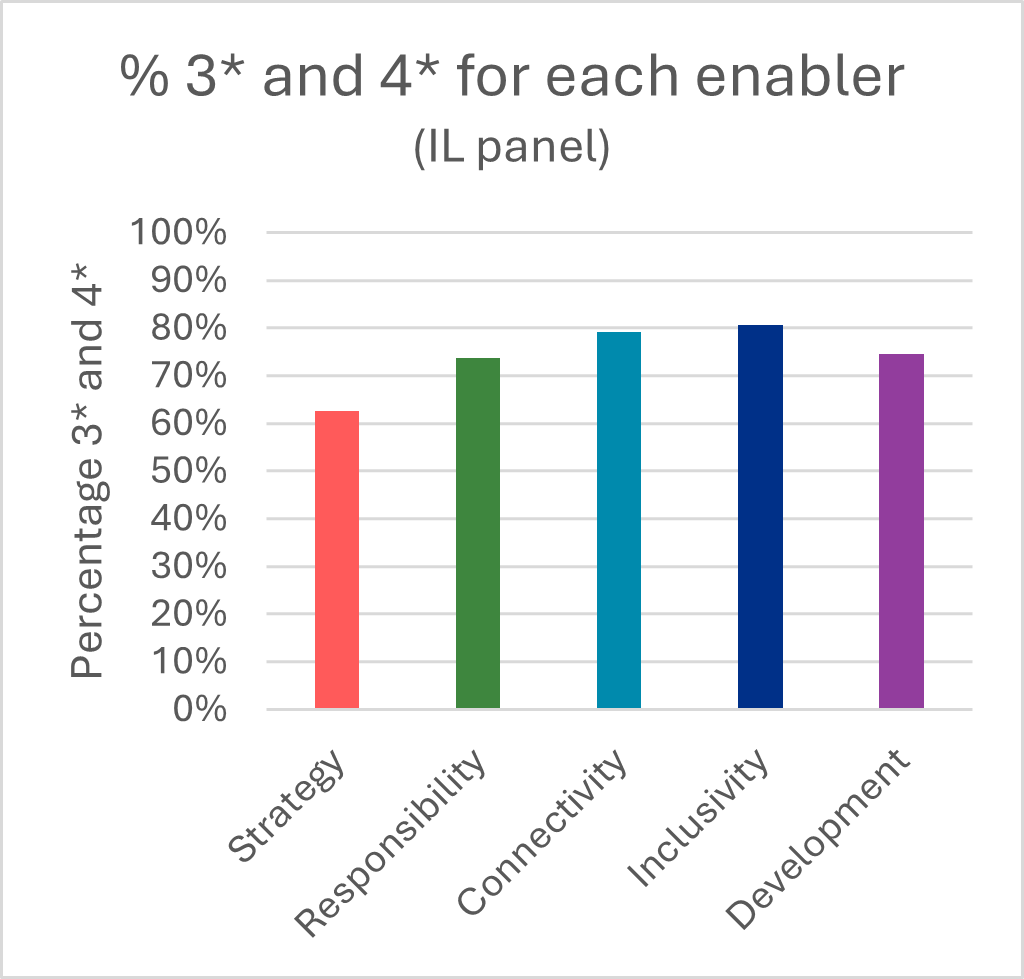
| Enabler | % 3* and 4* |
|---|---|
| Strategy | 62.6 |
| Responsibility | 73.7 |
| Connectivity | 79.1 |
| Inclusivity | 80.5 |
| Development | 74.5 |
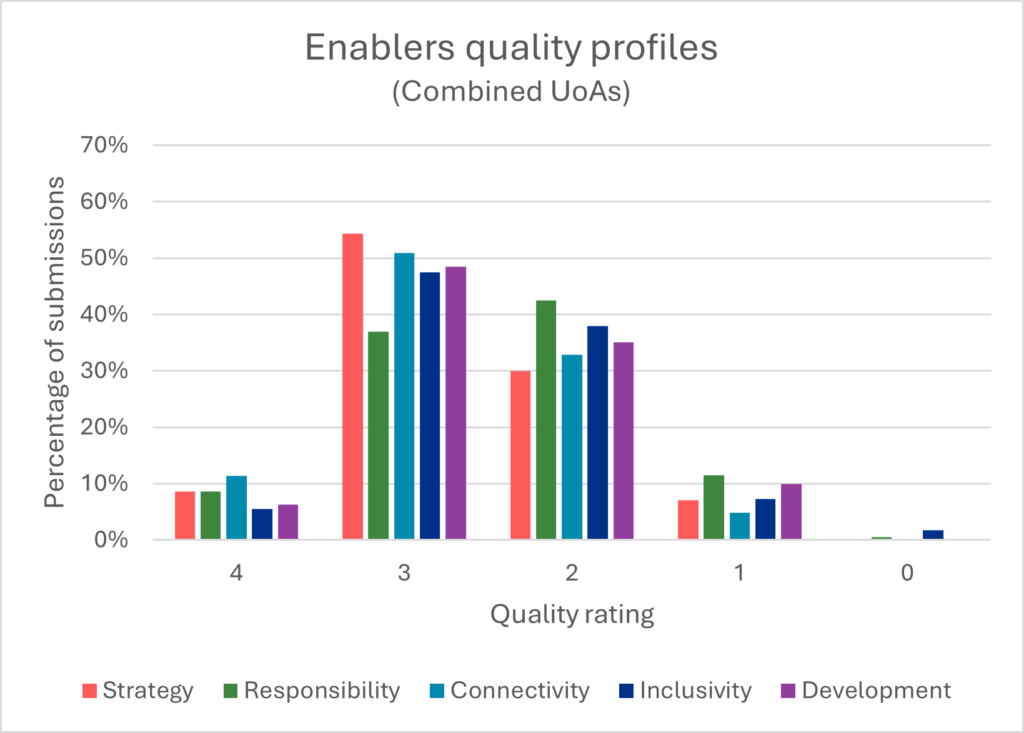
| Enabler/Quality Rating (%) | 4 | 3 | 2 | 1 | 0 |
|---|---|---|---|---|---|
| Strategy | 8.6 | 54.3 | 29.9 | 7 | 0 |
| Responsibility | 8.6 | 36.9 | 42.5 | 11.5 | 0.5 |
| Connectivity | 11.3 | 50.9 | 32.8 | 4.9 | 0 |
| Inclusivity | 5.5 | 47.5 | 38 | 7.3 | 1.7 |
| Development | 6.3 | 48.4 | 35.1 | 10 | 0 |
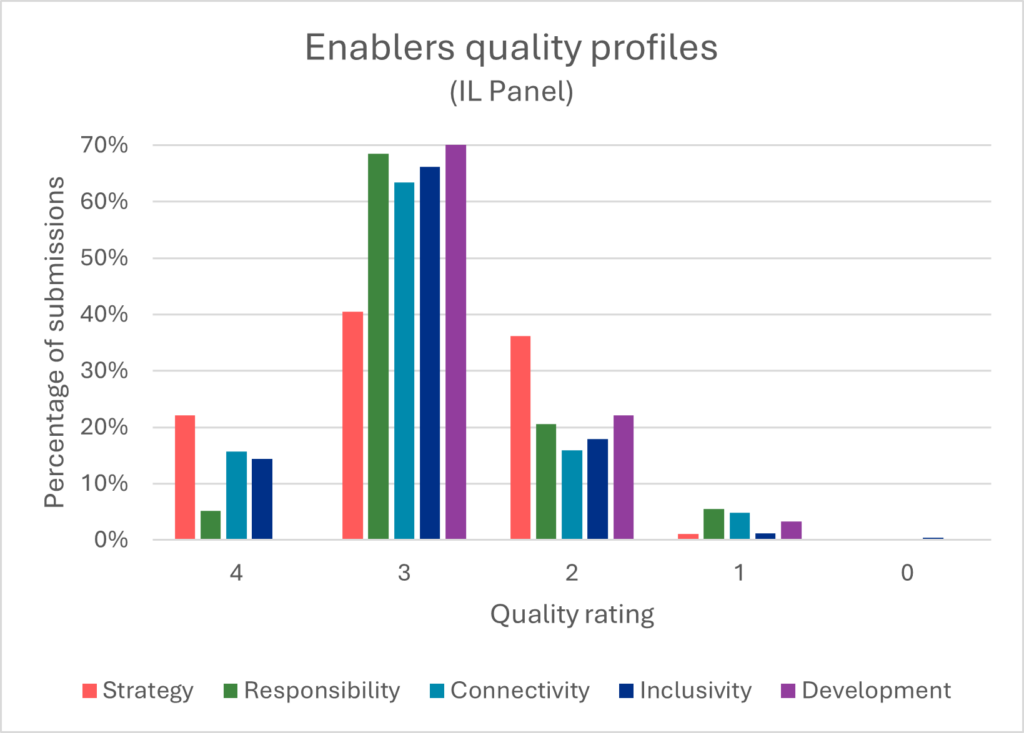
| Enabler/Quality Rating (%) | 4 | 3 | 2 | 1 | 0 |
|---|---|---|---|---|---|
| Strategy | 22.1 | 40.5 | 36.2 | 1.1 | 0 |
| Responsibility | 5.2 | 68.5 | 20.6 | 5.5 | 0 |
| Connectivity | 15.7 | 63.5 | 15.9 | 4.8 | 0 |
| Inclusivity | 14.4 | 66.1 | 17.9 | 1.2 | 0.4 |
| Development | 0 | 74.5 | 22.1 | 3.3 | 0 |
Charts 3 and 4 show the grade point averages for each enabler for the combined unit-level assessment, and for the institution-level assessment. Charts 5 and 6 show the percentages of 3* and 4* scores for the combined unit-level assessment and for the institution-level assessment. Charts 7 and 8 show quality profiles for each enabler. Overall, there does not appear to be a significant difference in the grade point average scores, though there is some variation in the quality profiles; for example, Responsibility appears to score lower at unit-level. Though scores appear to be generally lower than for Environment assessment in REF 2021, there appears to be reasonable consistency between the different enablers with no particular enabler scoring significantly higher or lower than the others.
UoAs
The following charts (Charts 9 to 18) report the results of the pilot for each UoA and for the institution-level panel.
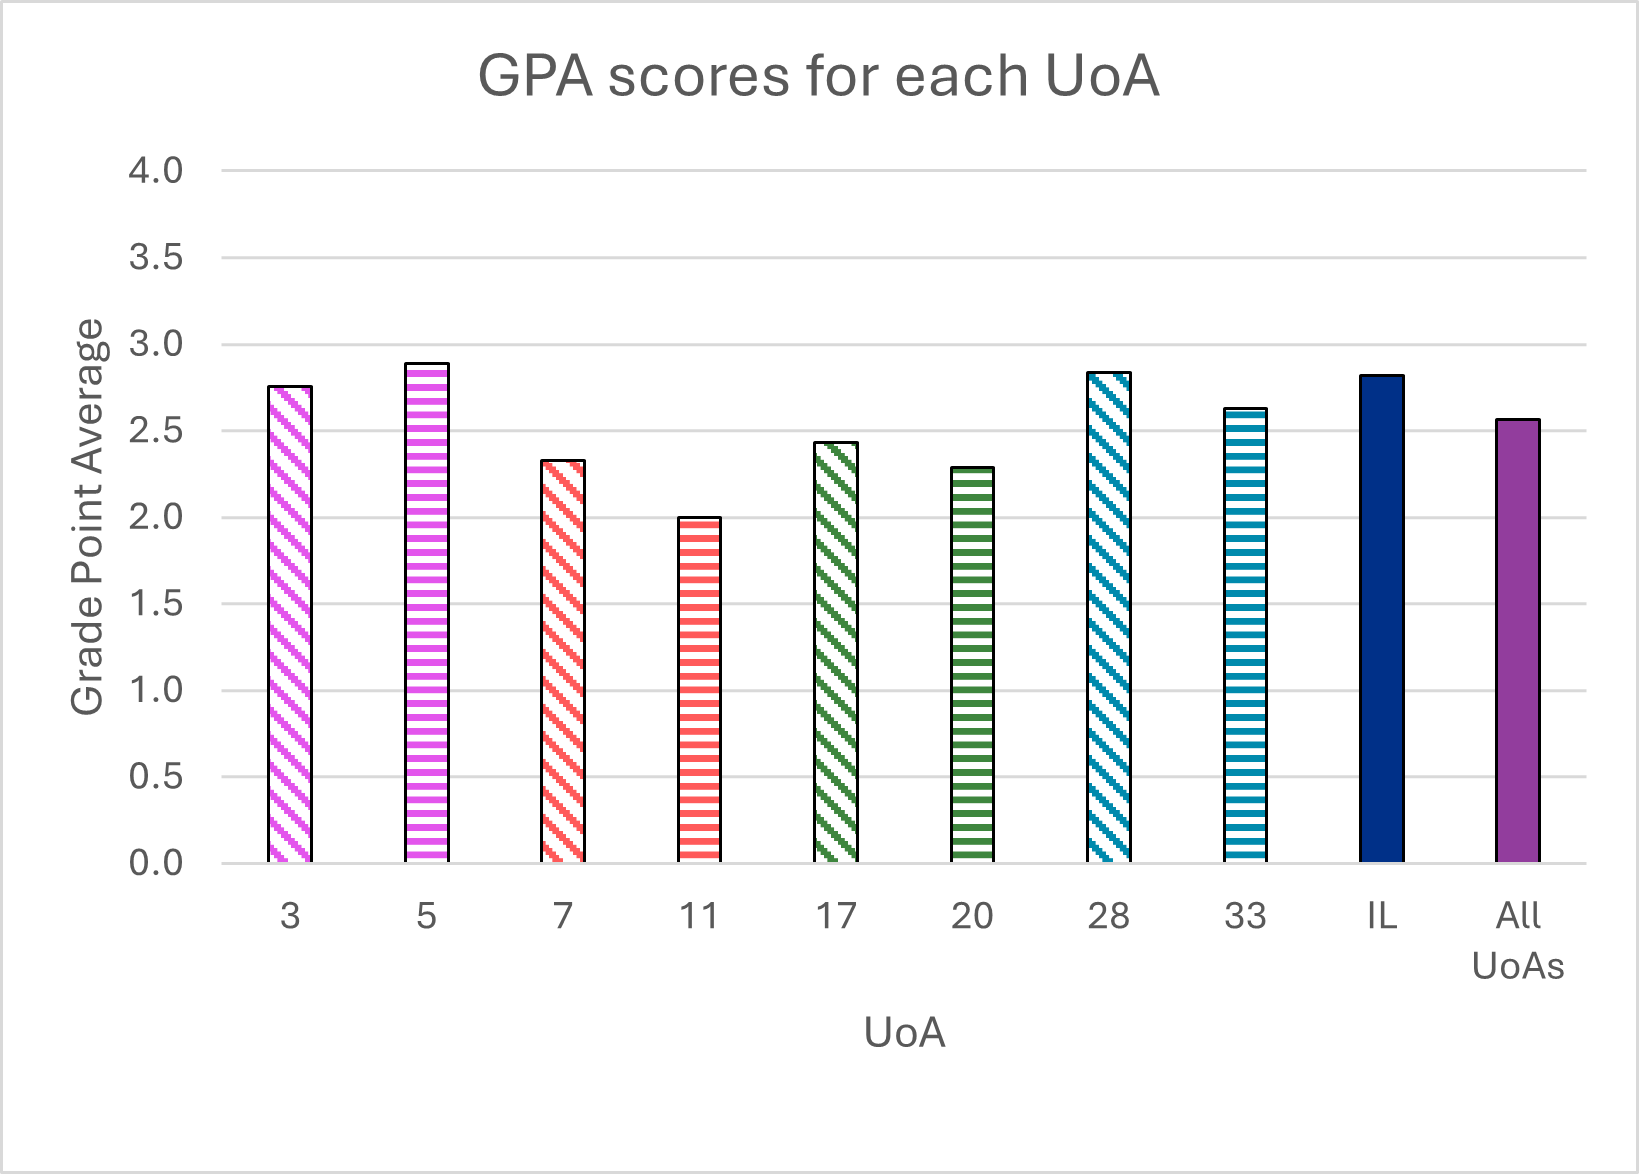
| UoA | Grade Point Average |
|---|---|
| 3 | 2.76 |
| 5 | 2.89 |
| 7 | 2.33 |
| 11 | 2.00 |
| 17 | 2.43 |
| 20 | 2.29 |
| 28 | 2.83 |
| 33 | 2.63 |
| IL | 2.82 |
| All UoAs | 2.56 |
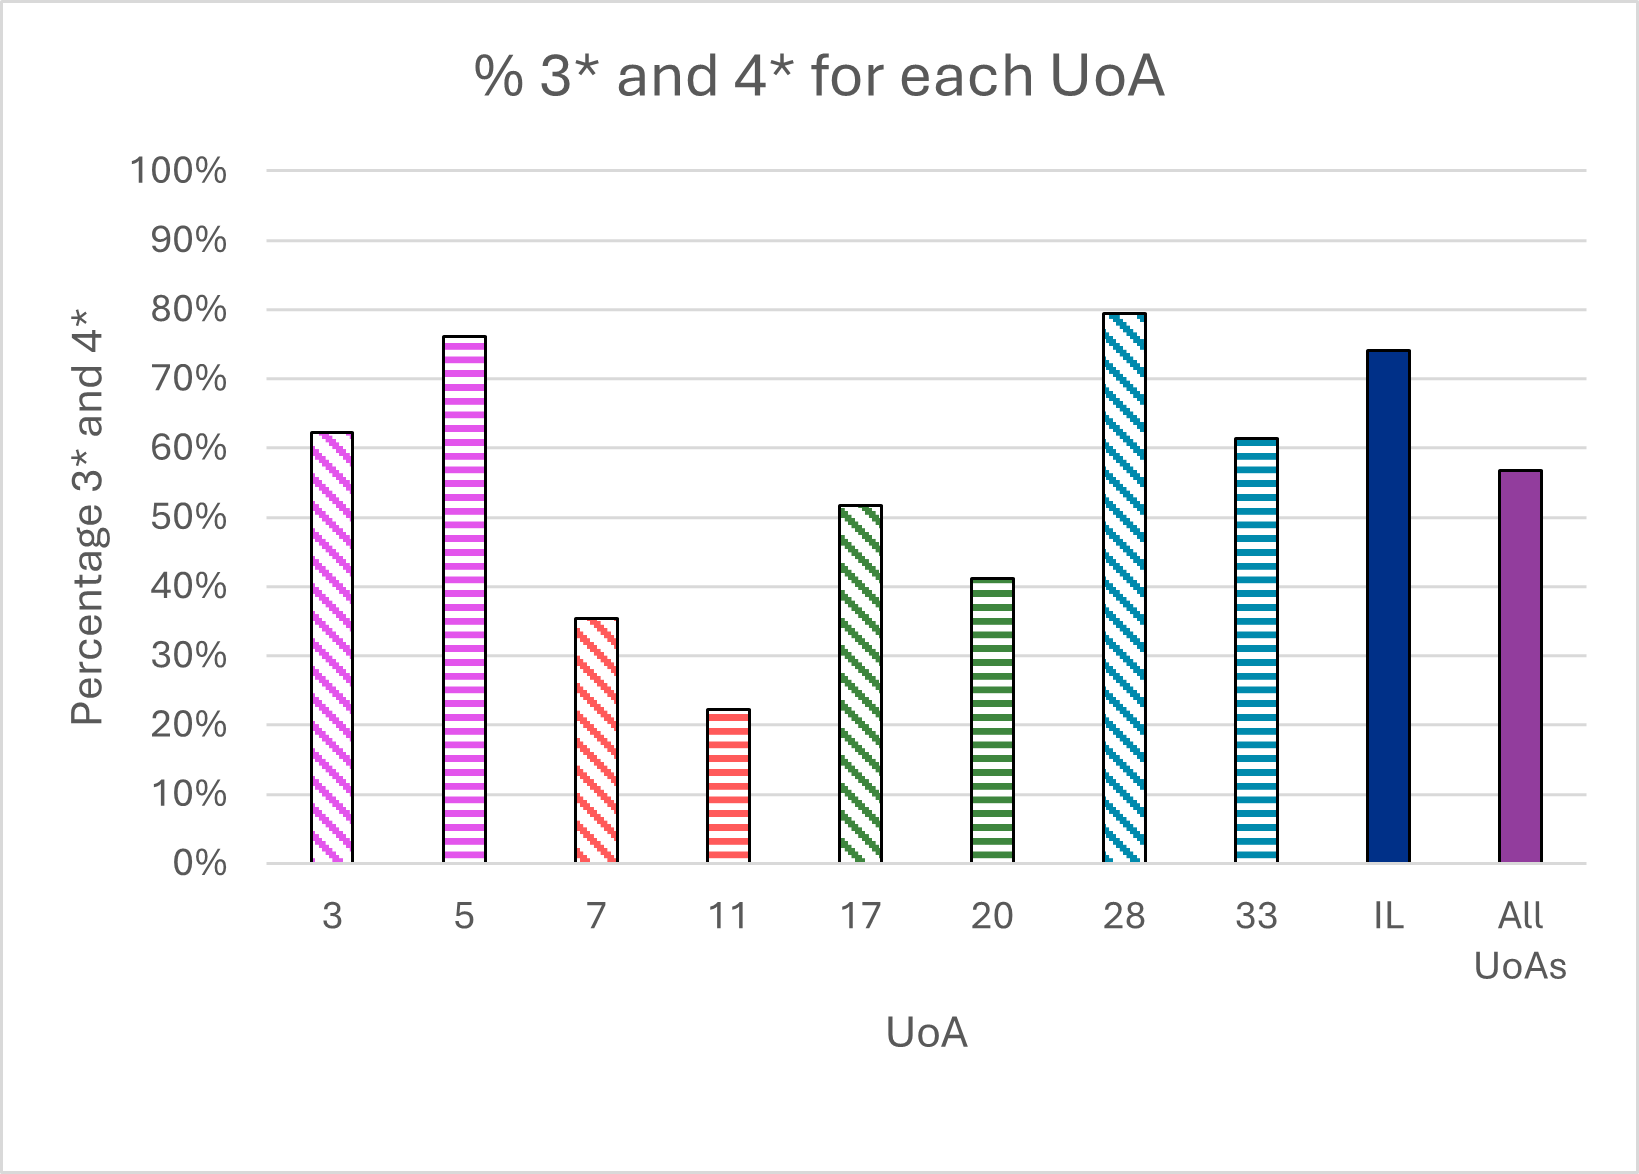
| UoA | 4* and 3* (%) |
|---|---|
| 3 | 62.2 |
| 5 | 76.1 |
| 7 | 35.3 |
| 11 | 22.2 |
| 17 | 51.6 |
| 20 | 41.2 |
| 28 | 79.4 |
| 33 | 61.4 |
| IL | 74.1 |
| All UoAs | 56.8 |
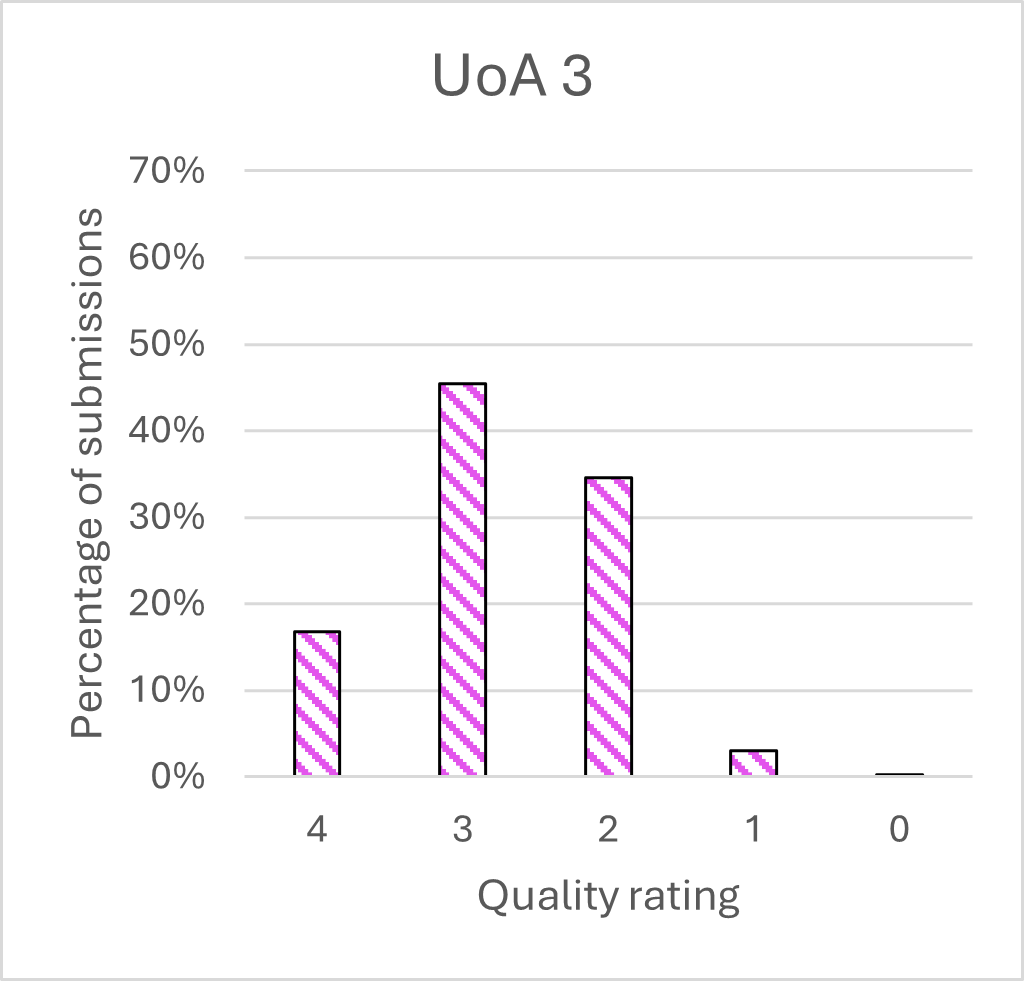
| Quality rating | Percentage |
|---|---|
| 4 | 16.8 |
| 3 | 45.4 |
| 2 | 34.5 |
| 1 | 3.0 |
| 0 | 0.3 |
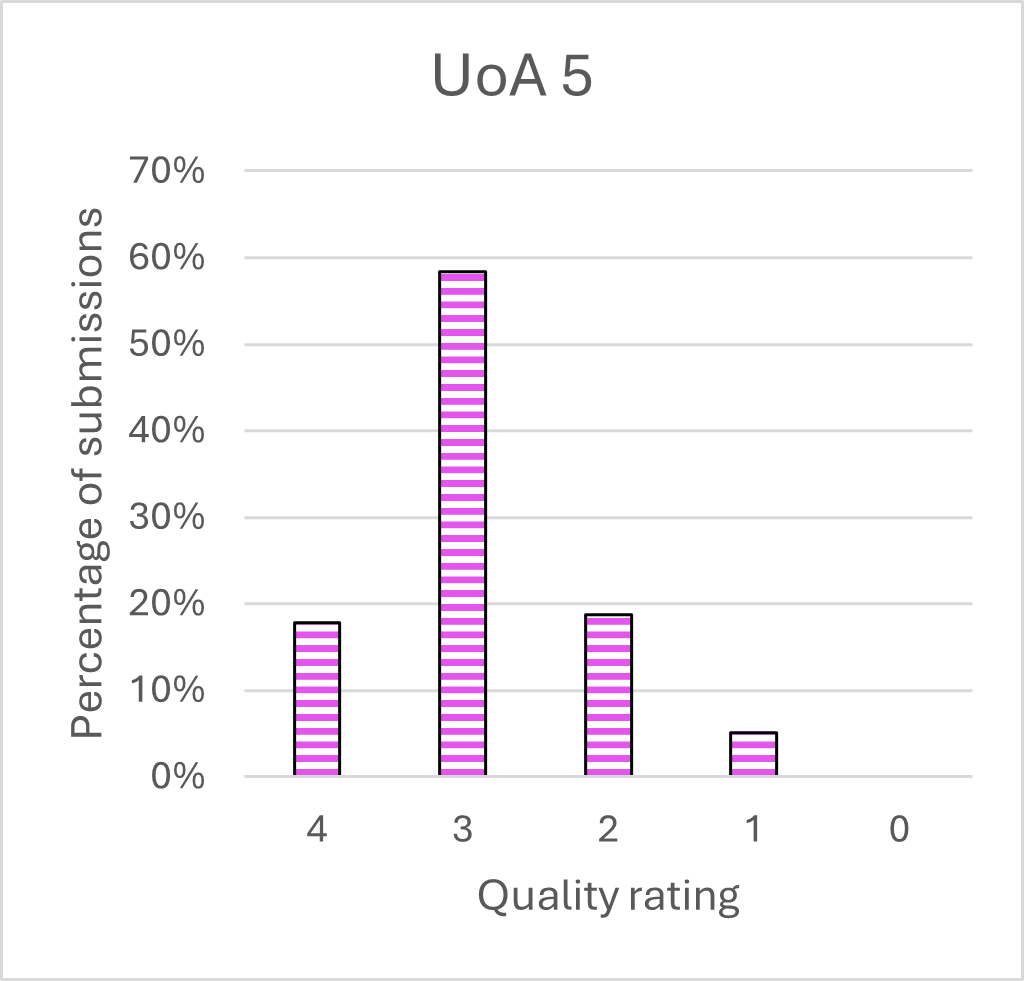
| Quality rating | Percentage |
|---|---|
| 4 | 17.8 |
| 3 | 58.4 |
| 2 | 18.7 |
| 1 | 5.1 |
| 0 | 0.0 |
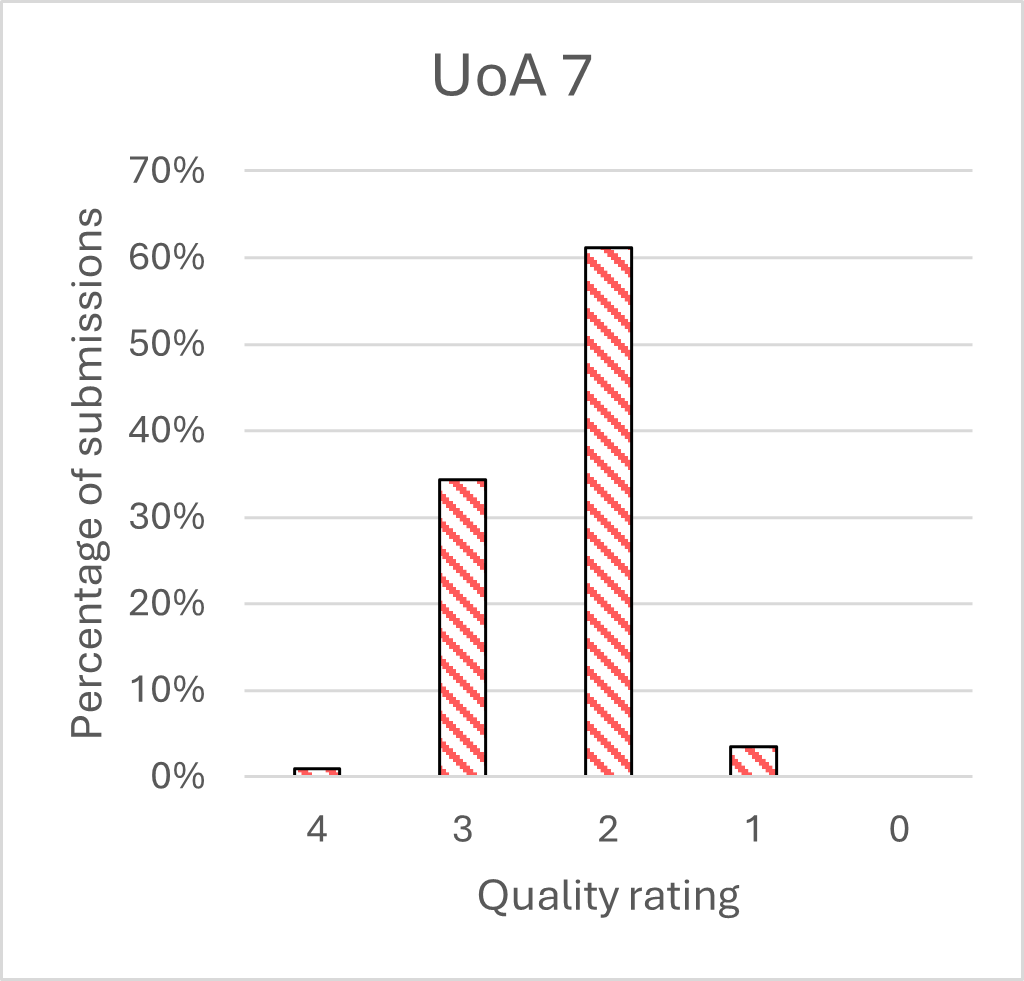
| Quality rating | Percentage |
|---|---|
| 4 | 1.0 |
| 3 | 34.4 |
| 2 | 61.2 |
| 1 | 3.5 |
| 0 | 0.0 |
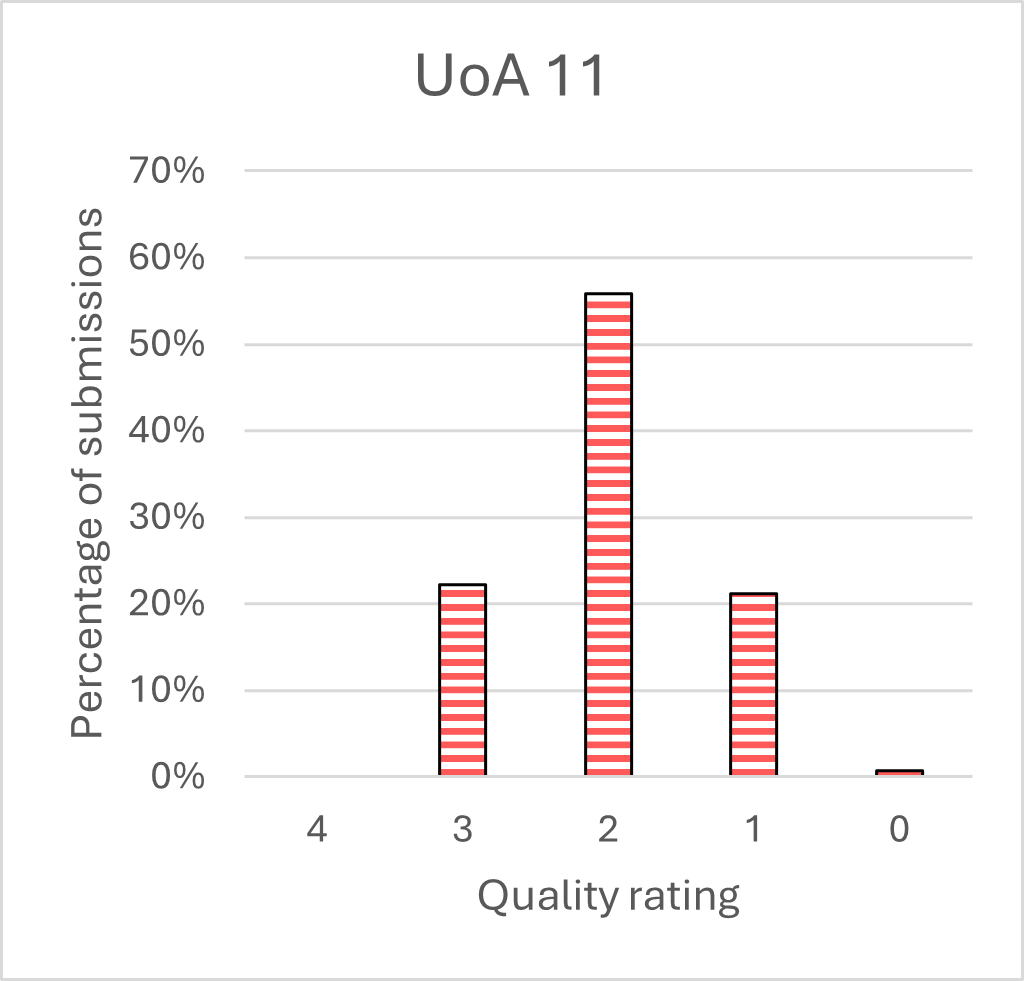
| Quality rating | Percentage |
|---|---|
| 4 | 0.0 |
| 3 | 22.2 |
| 2 | 55.8 |
| 1 | 21.2 |
| 0 | 0.8 |
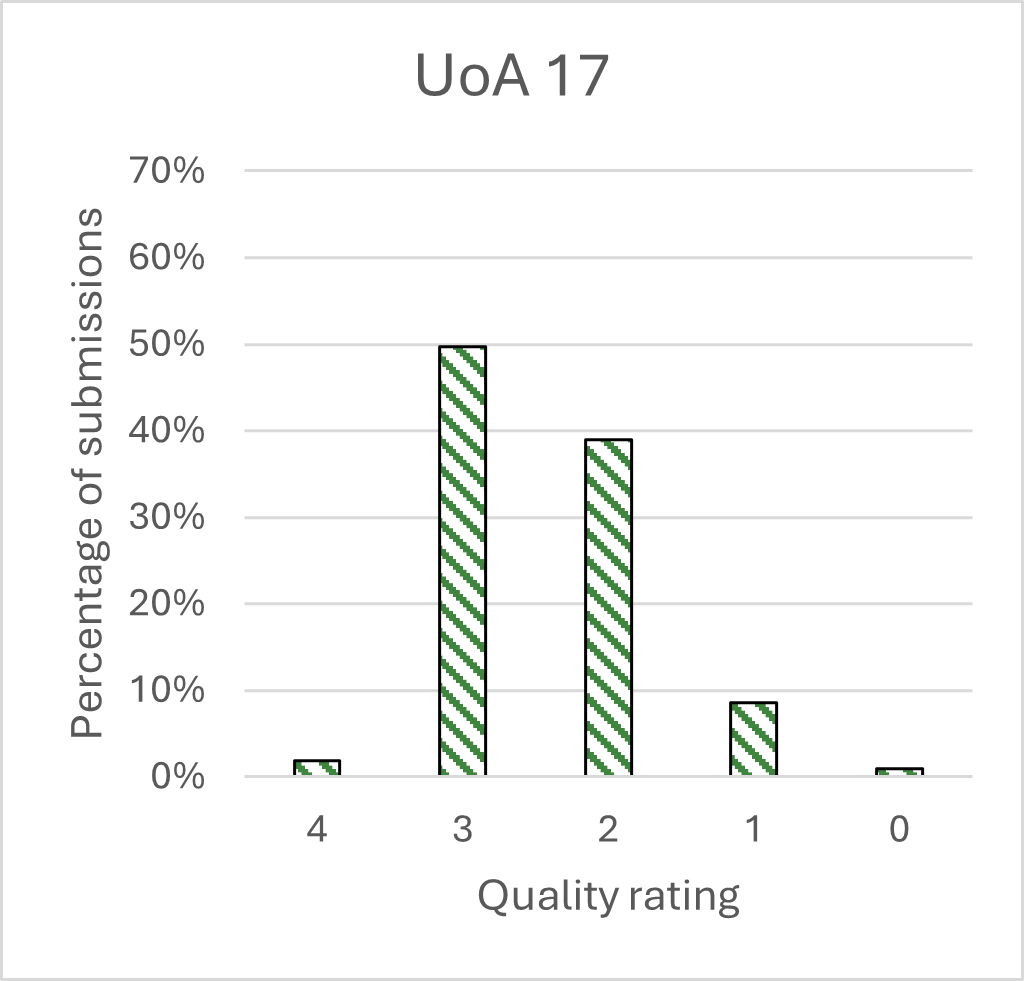
| Quality rating | Percentage |
|---|---|
| 4 | 1.9 |
| 3 | 49.8 |
| 2 | 38.9 |
| 1 | 8.5 |
| 0 | 1.0 |
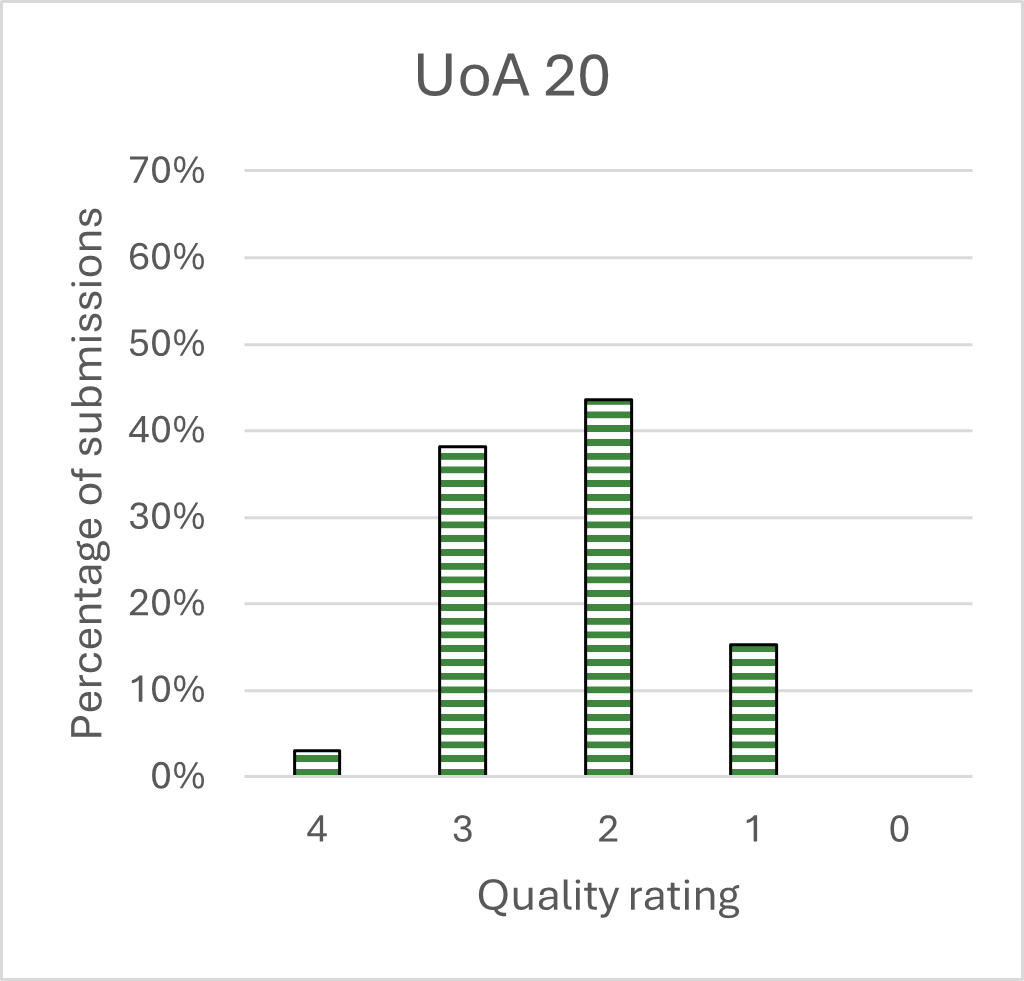
| Quality rating | Percentage |
|---|---|
| 4 | 3.0 |
| 3 | 38.1 |
| 2 | 43.5 |
| 1 | 15.3 |
| 0 | 0.0 |
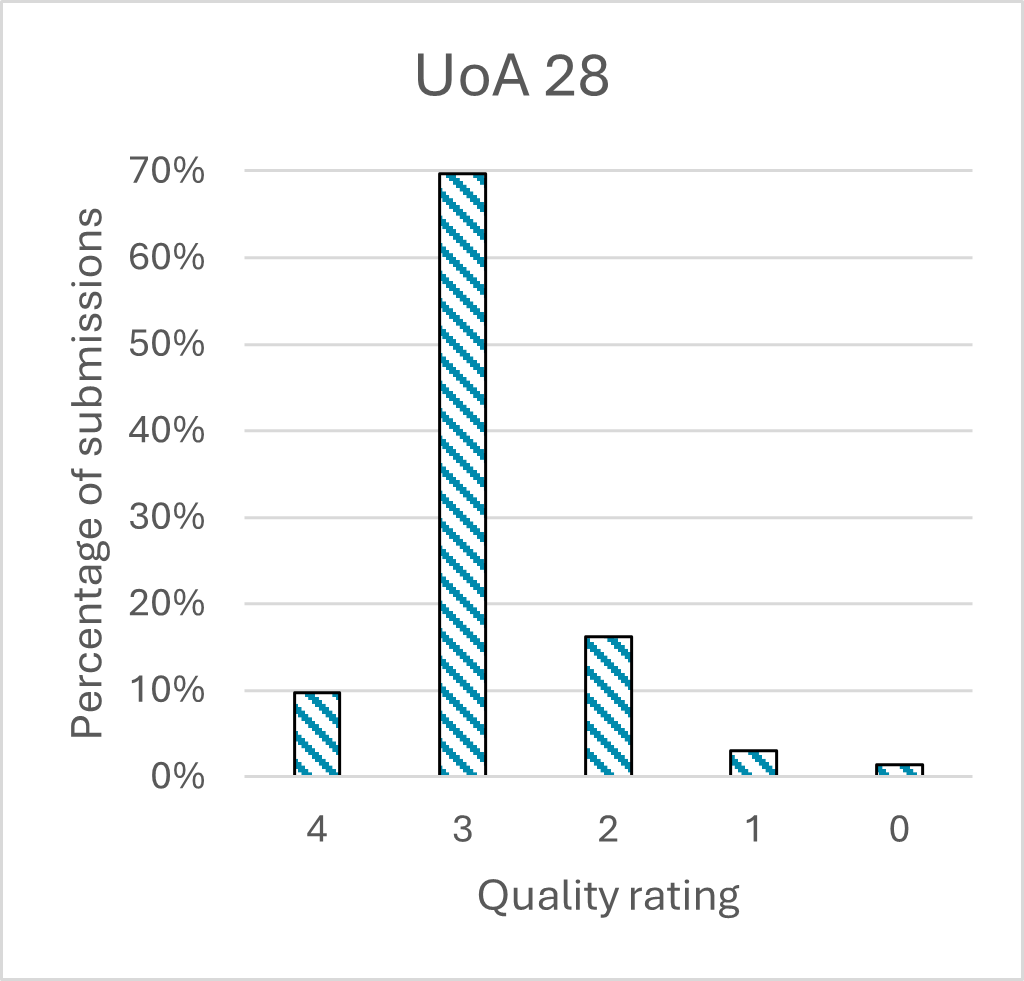
| Quality rating | Percentage |
|---|---|
| 4 | 9.7 |
| 3 | 69.7 |
| 2 | 16.2 |
| 1 | 3.0 |
| 0 | 1.4 |
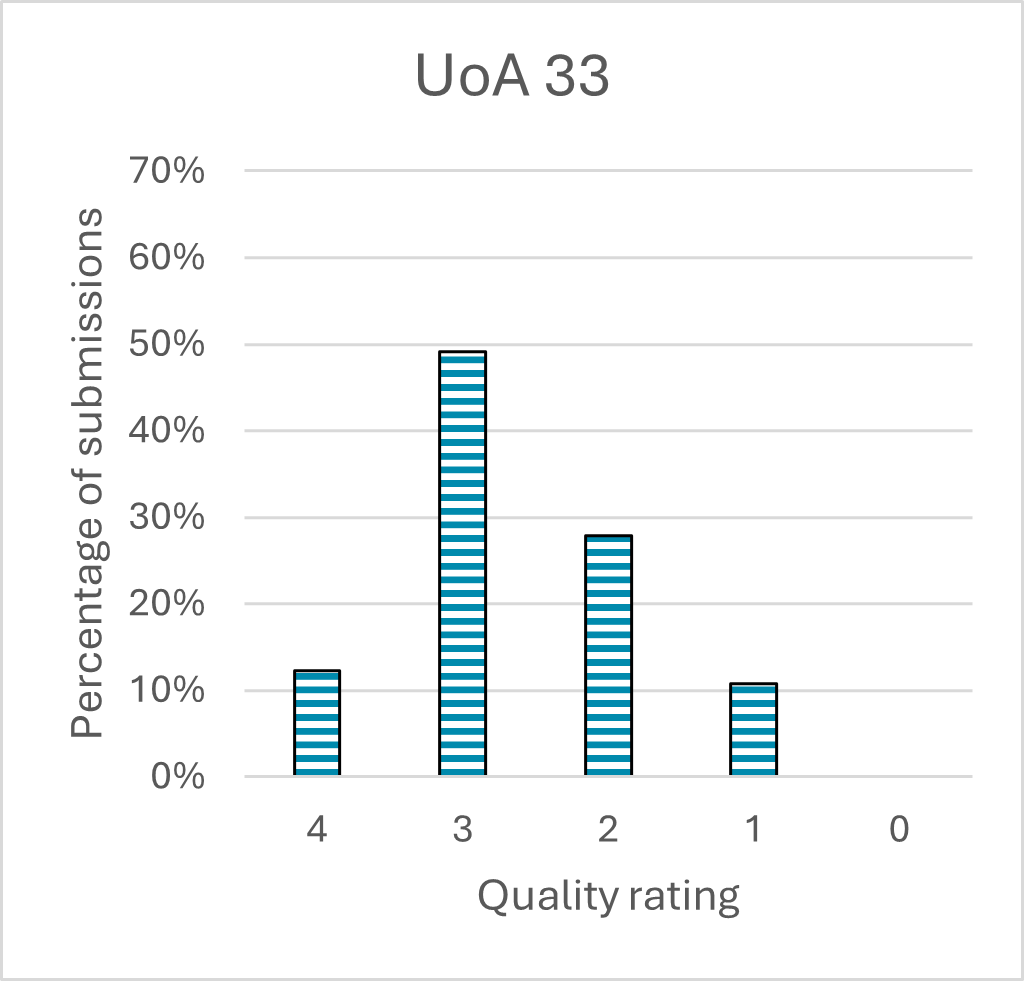
| Quality rating | Percentage |
|---|---|
| 4 | 12.3 |
| 3 | 49.1 |
| 2 | 27.9 |
| 1 | 10.7 |
| 0 | 0.0 |
Charts 9 and 10 show the grade point average scores for each UoA. Charts 11 to 18 show the quality profile for each UoA. There is some variation between the profiles for the different UoAs. Variation in scoring could be due to different approaches to the assessment between the assessment panels so should not be considered as differences in the quality of PCE approaches between different subject areas. Institution-level assessment was generally above the mean for the pilot, though this is likely due to better availability of evidence and data at institution-level.
Institutional type
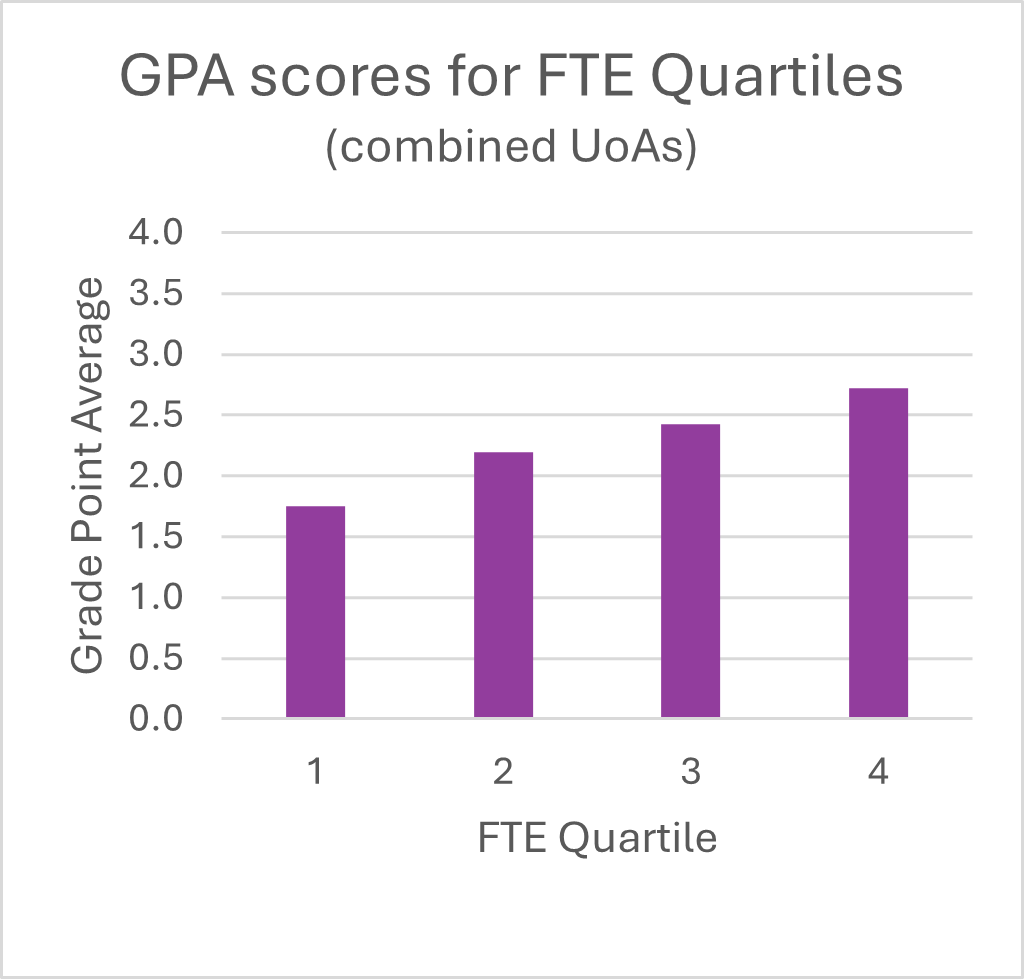
| Quality rating | Grade Point Average |
|---|---|
| 1 | 1.75 |
| 2 | 2.19 |
| 3 | 2.43 |
| 4 | 2.72 |
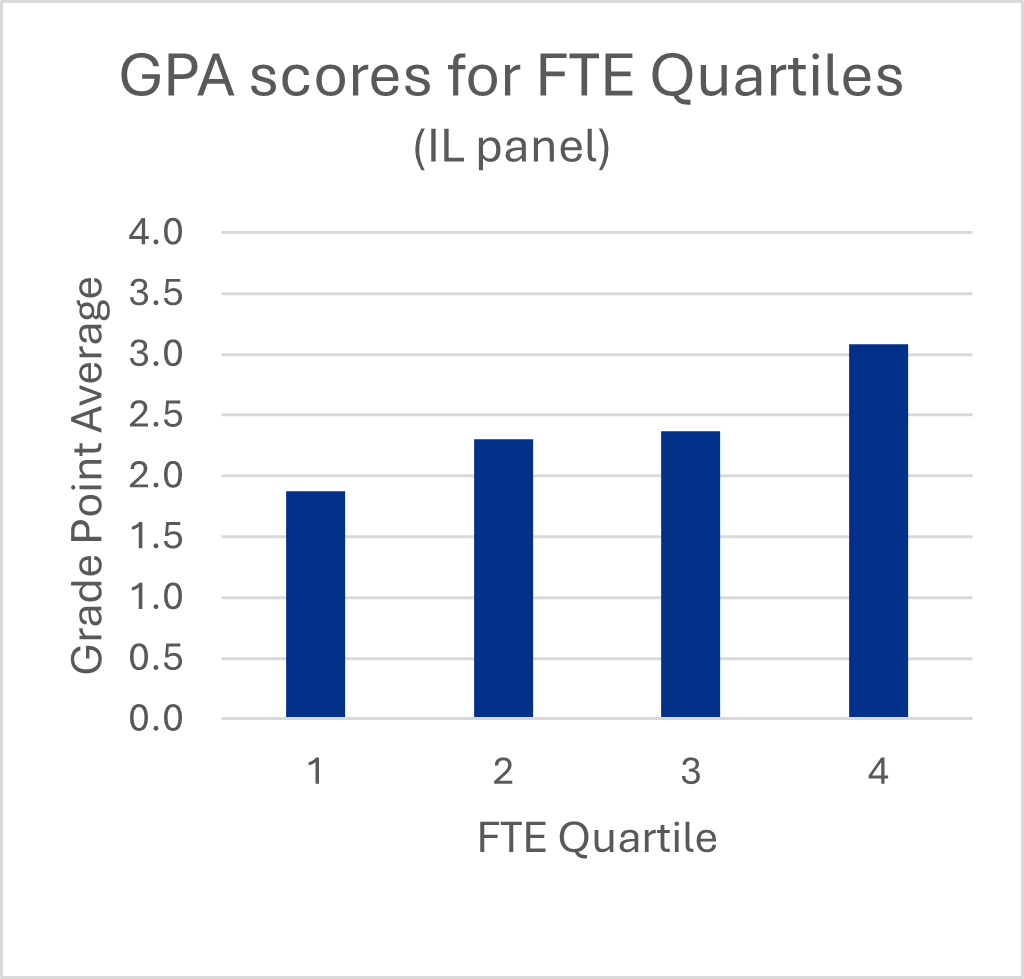
| Quality rating | Grade Point Average |
|---|---|
| 1 | 1.88 |
| 2 | 2.30 |
| 3 | 2.37 |
| 4 | 3.09 |
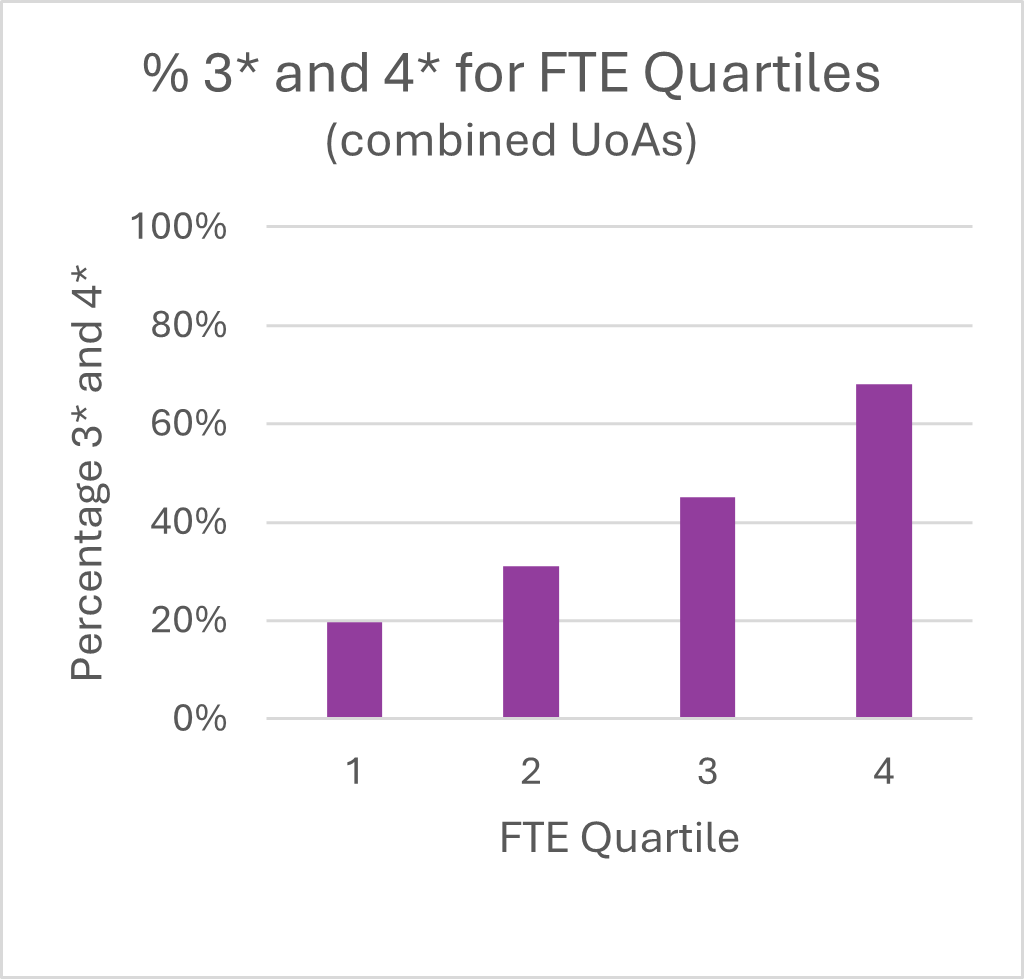
| Quality rating | 3* and 4* (percentage) |
|---|---|
| 1 | 19.7 |
| 2 | 31.1 |
| 3 | 45.2 |
| 4 | 68.1 |
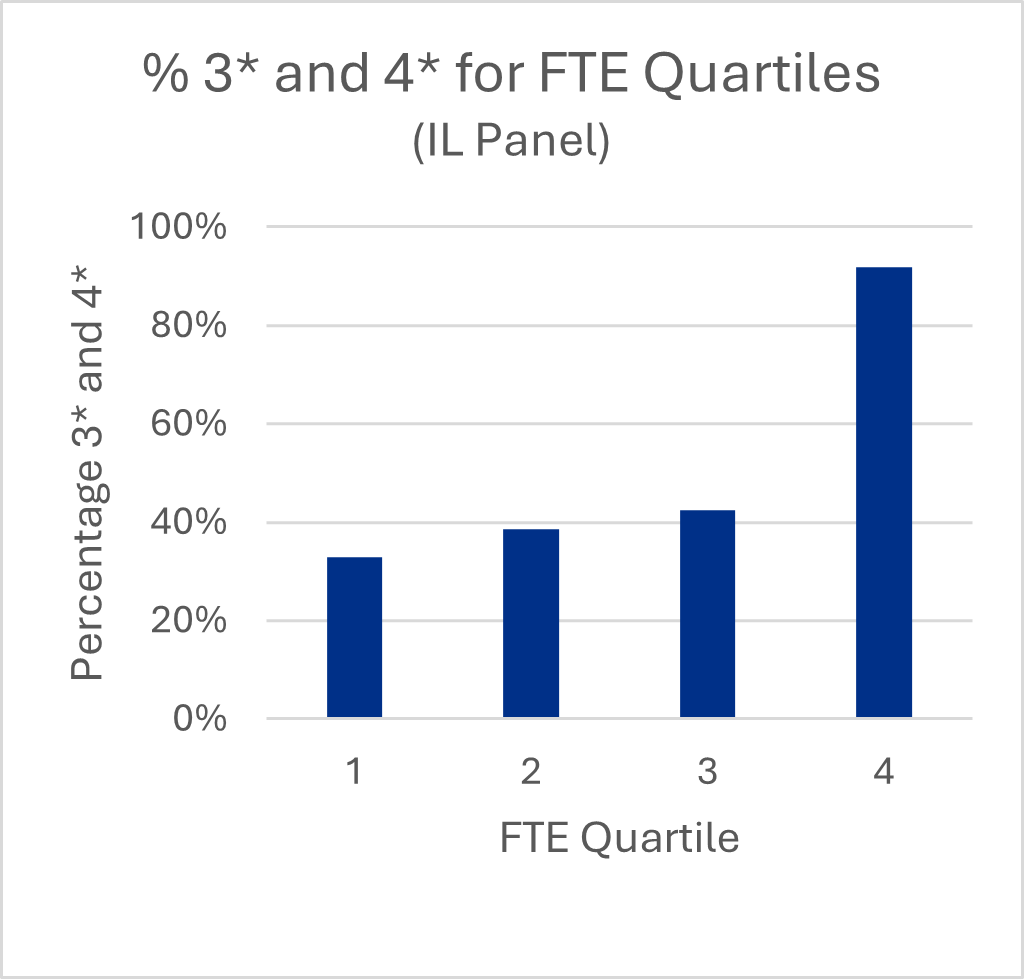
| Quality rating | 3* and 4* (percentage) |
|---|---|
| 1 | 32.8 |
| 2 | 38.5 |
| 3 | 42.5 |
| 4 | 91.8 |
Charts 19 and 20 show the grade point average scores for each different size of institution, using data on submissions to the REF 2021 exercise as an indicator of institutional size/research intensity (all of the institutions which participated in REF 2021 were listed in order of the total FTE they submitted to the exercise and the list was divided into four equal quartiles). Charts 21 and 22 show the percentage of 4* and 3* scores for different sizes of institution.
There is a clear trend with larger institutions scoring higher on average than smaller institutions. This trend is apparent despite the panels’ efforts to be as inclusive as possible in their approach to the assessment. Often evidence was lacking for smaller institutions and the panels were less confident in awarding higher scores. Differences could also be attributed to different approaches taken by the participating HEIs in developing their submissions and should not be interpreted as differences in the quality of the PCE operating at smaller institutions.